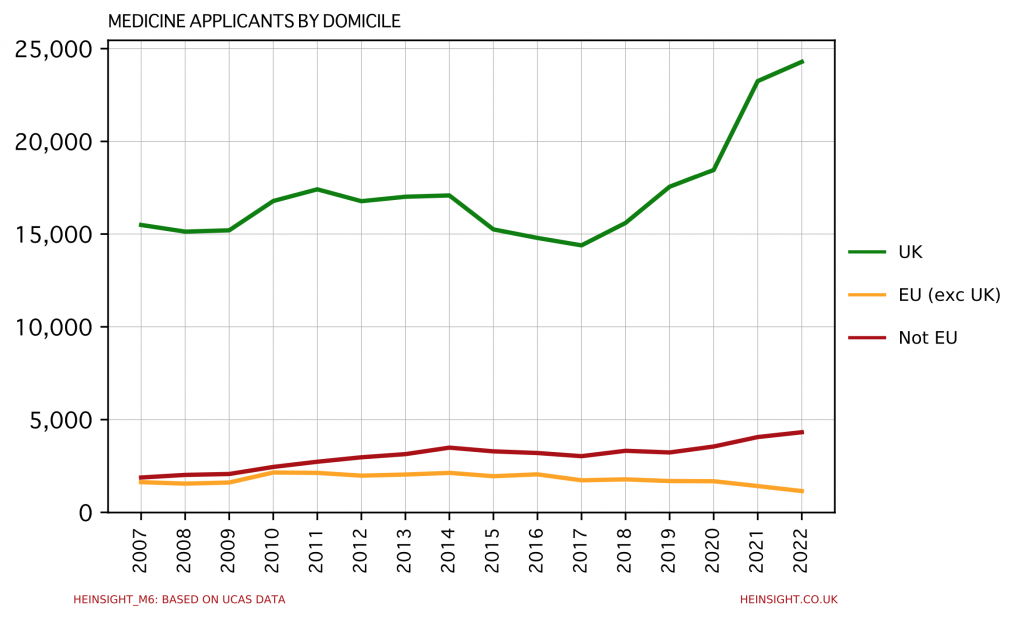
UCAS’ October deadline statistics, released this week, make for interesting reading as ever. The number of UK applicants to Medicine has risen by a further 4% after last year’s huge increase, bringing the size of the applicant pool to a new all time high.
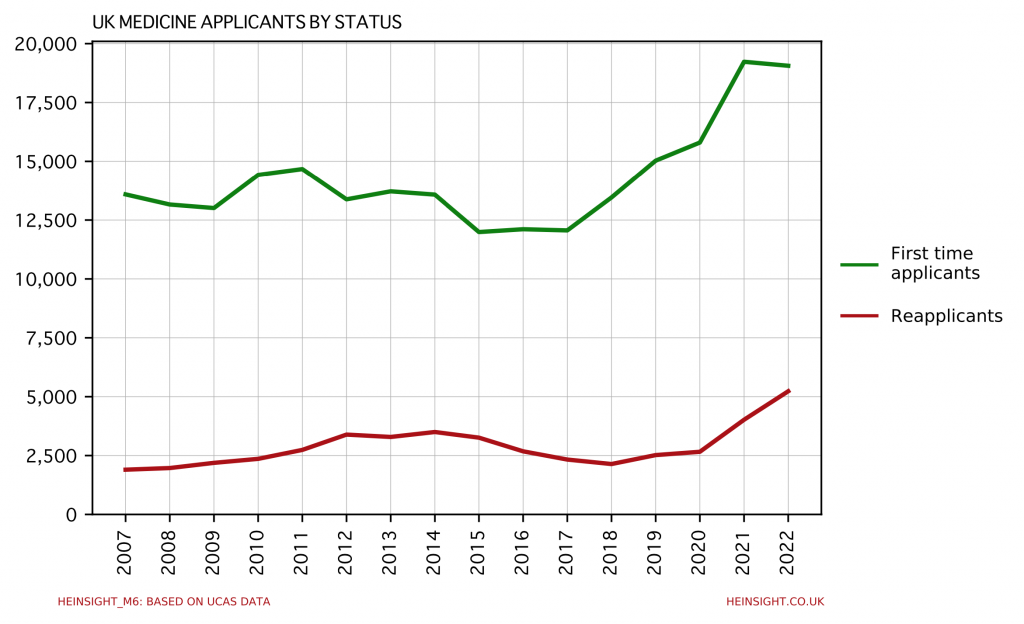
Breaking out first time applicants from what UCAS terms ‘reapplicants’ however reveals a more complex picture. Whilst the former group have actually marginally fallen in number, the latter have driven all of the growth seen in our headline figure.
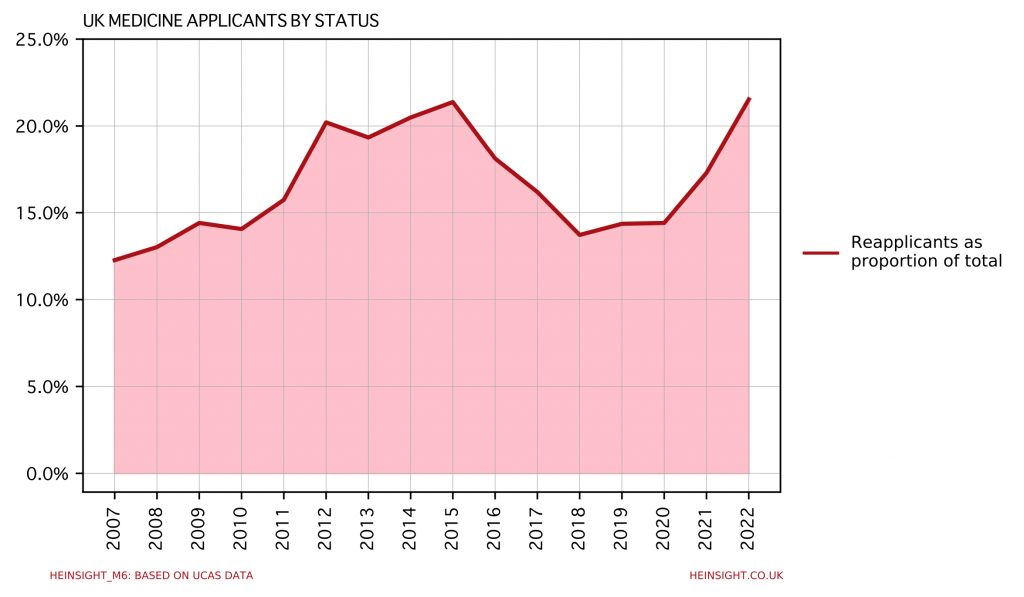
Plotting the reapplicant group as a proportion of the total UK medicine applicant pool shows a rise from 14% pre-covid to 22% now, returning the group back to the level of the previous peak seen in the 2015 cycle.
UCAS’ definition of reapplicant here doesn’t require these individuals to have applied to Medicine before, just that they have submitted an application to any course through UCAS in a previous cycle. So these aren’t necessarily those who have already been turned away by a medical school, although they will be a component of this group. Another component however, and likely the one driving this growth, will be those who previously applied for non-medicine courses but having benefitted from the increasingly generous awarding of grades in the past two years have now returned with new aspirations.
With this same grade generosity having pushed many medical schools over capacity in the 2021 cycle and their offer making in this cycle likely to be even more cautious than normal as a result, these reapplicants chances of securing a medicine place unfortunately may not be a high as they’re hoping – even if they’re sitting on top grades.
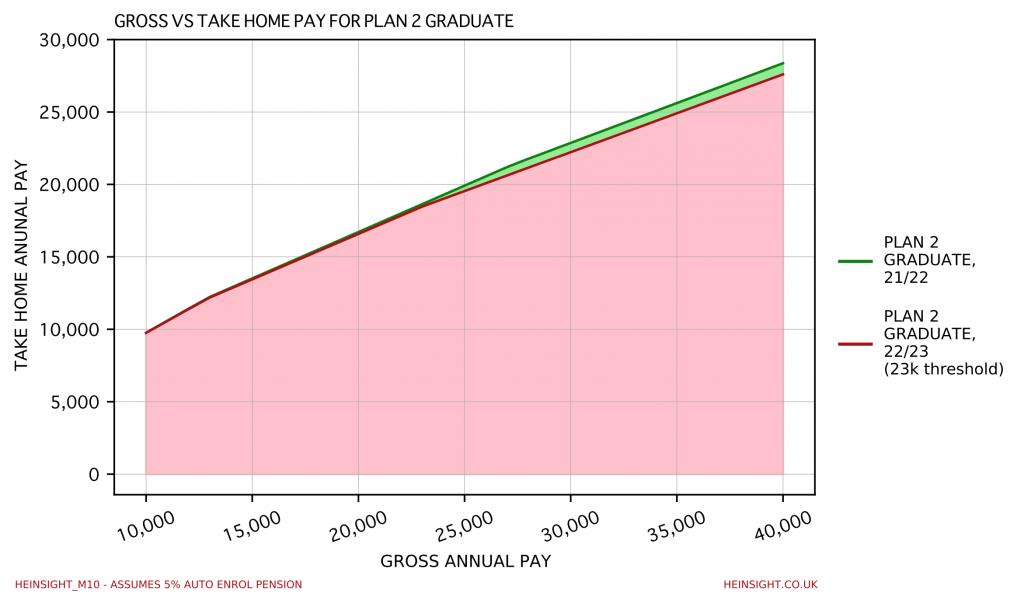
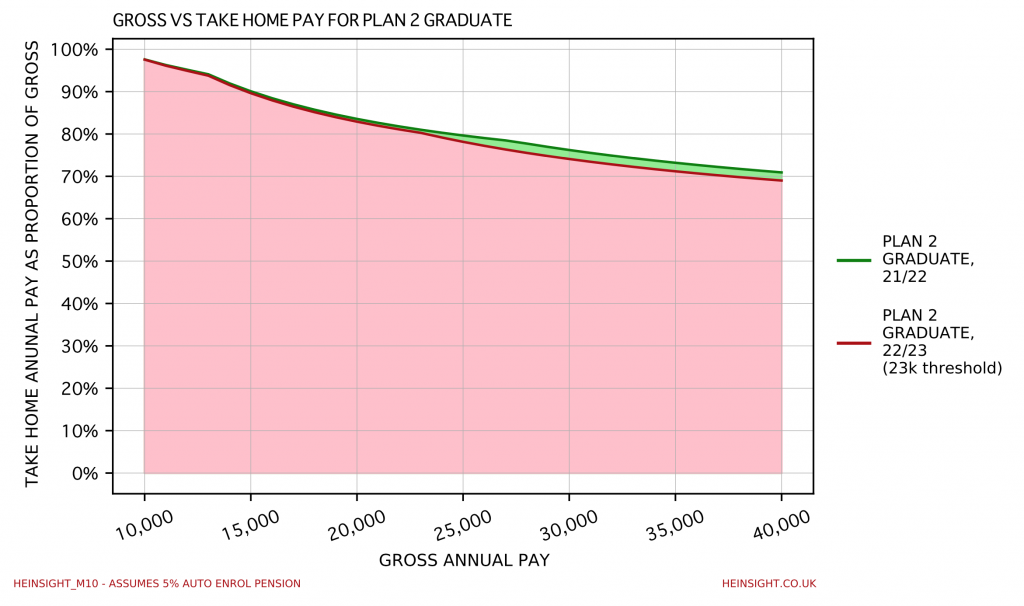
As the FT reported on Monday (paywall), the government is said to be considering lowering the student loan repayment threshold to £23,000, down significantly from a little over £27,000 as it currently stands. It remains to be seen if, in the event that this comes to pass, the government attempts to apply these changes retrospectively to those already holding Plan 2 loans or settles for establishing these new terms for new graduates or new students, perhaps alongside other headline grabbing changes to HE funding recommended by the Augar Review.
If the threshold is lowered to this figure however then those subject to it will feel the impact on their take home pay particularly strongly in the next tax year thanks to it coinciding with the previously announced rise in national insurance rates (see here for our previous work on this topic).
The two changes together would shave around £640 a year off the take home pay of a graduate earning £30,000, or around £53 a month, compared to the current tax year.
Assuming a standard 5% auto enrolment pension, our graduate on £30,000 would go from taking home 76.2% of their gross pay to taking home 74.1% of it.
With high inflation already eroding living standards any move to extract further bonuses for the Treasury from young workers would no doubt prompt future school leavers, especially those from the most disadvantaged backgrounds, to reconsider if higher education is worth the price.
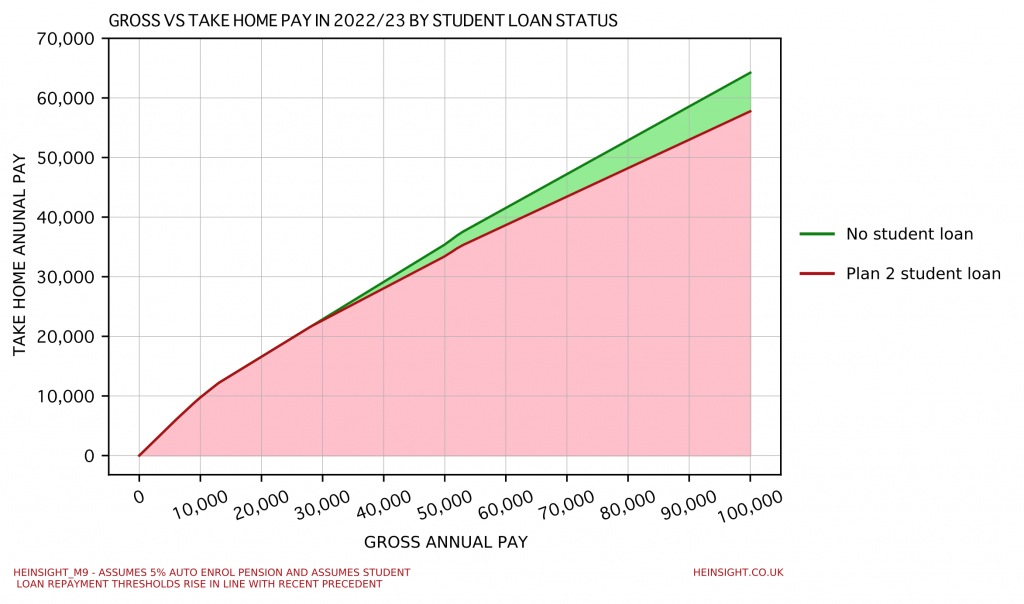
This week saw the announcement of a 1.25% increase in the main and higher employee class 1 national insurance contribution rates. Whilst student loans and national insurance don’t impact upon each other this is a good opportunity to review what the total burden of tax (and pensions) on graduates will be in 2022/23 and how this will differ from those without student loans to repay.
In the below we compare Plan 2 student loan holders with those without student loans and assume the following:
That both contribute 5% of their salary into a standard auto enrolment pension
That student loan repayment thresholds rise next year in line with recent historical precedent
That the employee class 1 national insurance contribution threshold remains unchanged at £9,568
We can see the divergence begin between our two individuals as they pass the Plan 2 repayment threshold at approx. £28,000 and widen from here on out.
Gross annual pay
Take home annual pay– no student loan
Take home annual pay – Plan 2 student loan
£25,000
£19,719
£19,719
£50,000
£35,406
£33,429
£75,000
£50,050
£45,823
£100,000
£64,238
£57,760
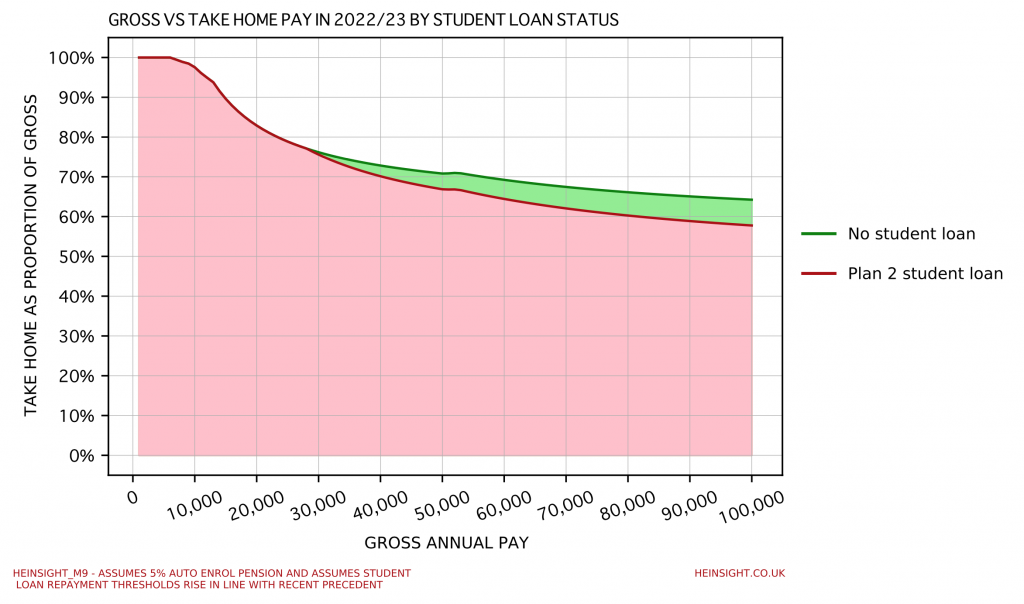
If we plot take home pay as a percentage of gross pay we can see the proportional burden of tax, student loan and pension on our two individuals.
Gross annual pay
Take home % – no student loan
Take home % – Plan 2 student loan
£25,000
78.9%
78.9%
£50,000
70.8%
66.9%
£75,000
66.7%
61.1%
£100,000
64.2%
57.8%
As ever larger segments of the young working age population find themselves burdened by student loans repayments it is essential that these student loans are included in discussions about changes to tax structures, or else we risk badly misjudging the impact of such changes on graduates.
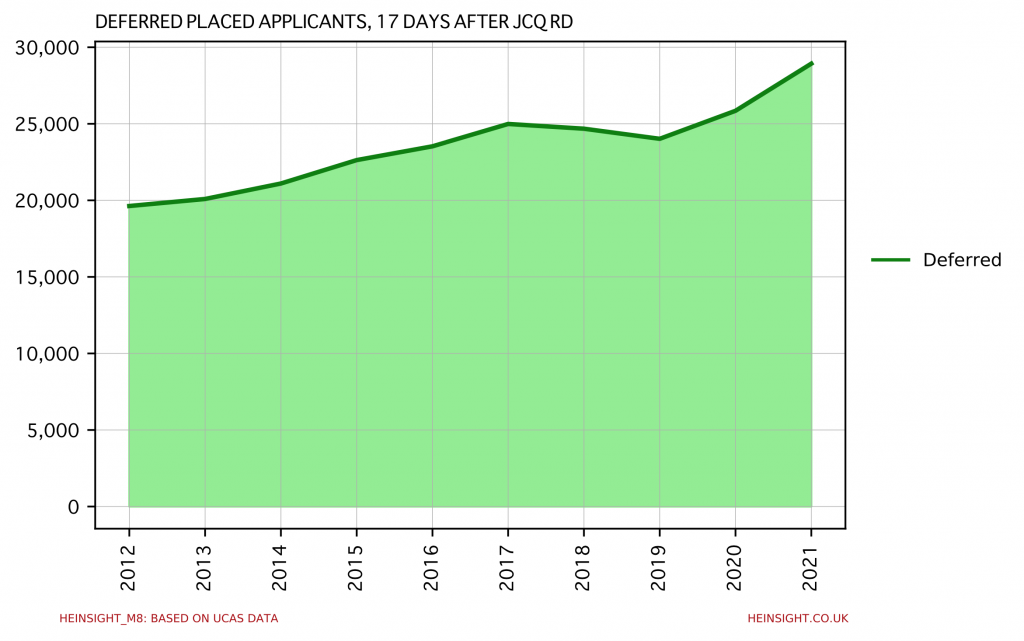
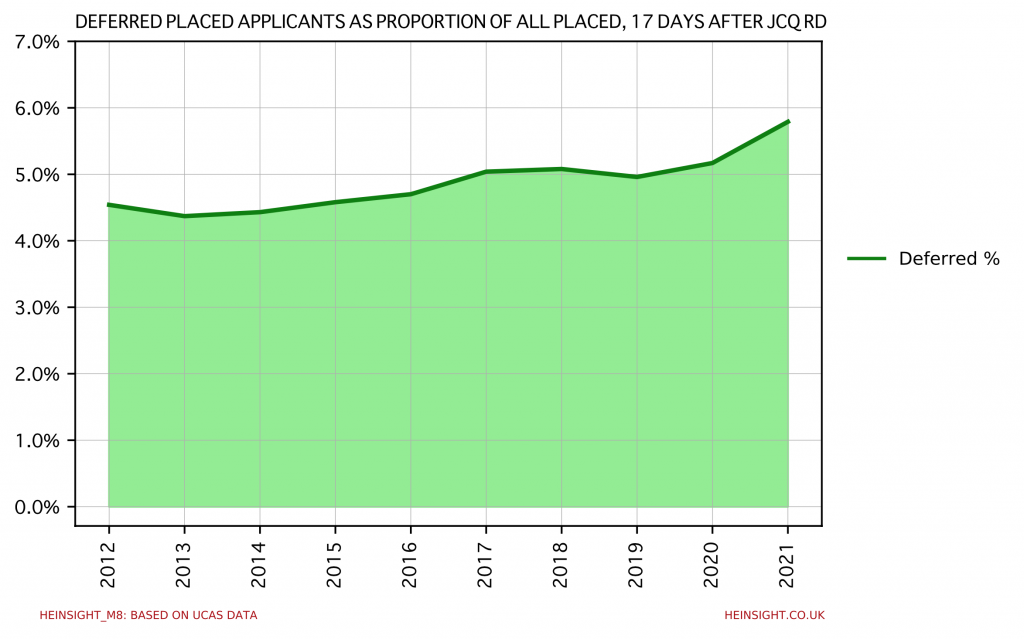
As The Times reported on Monday, UCAS statistics show that this year there are a record number of placed applicants who have deferred starting their studies. Approximately 29,000 applicants placed in this cycle are deferred in total.
This isn’t just a product of a higher total number of placed applicants but instead represents a notable rise in the proportion of placed applicants deferring their studies.
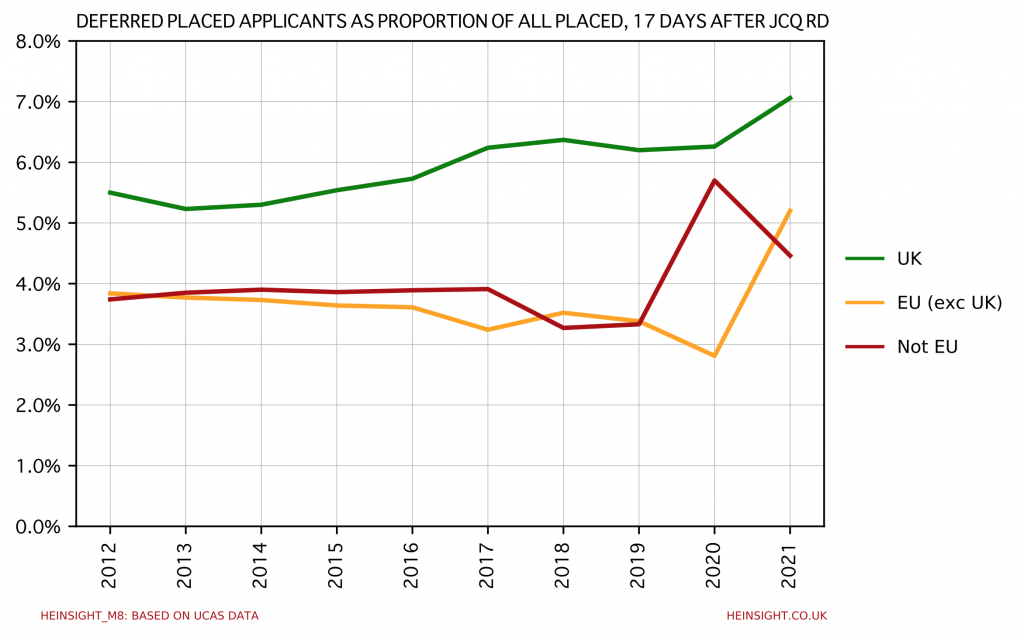
This rise in the deferral rate is being driven by UK and EU domiciled applicants. Whilst UK domiciled applicants continue to be most likely to defer, their EU domiciled peers have seen the biggest jump in their likelihood to defer – no doubt connected to their changed fee status. Meanwhile applicants from outside the UK or EU have bucked the trend and reduced their deferral rate from the unprecedented high observed in 2020.
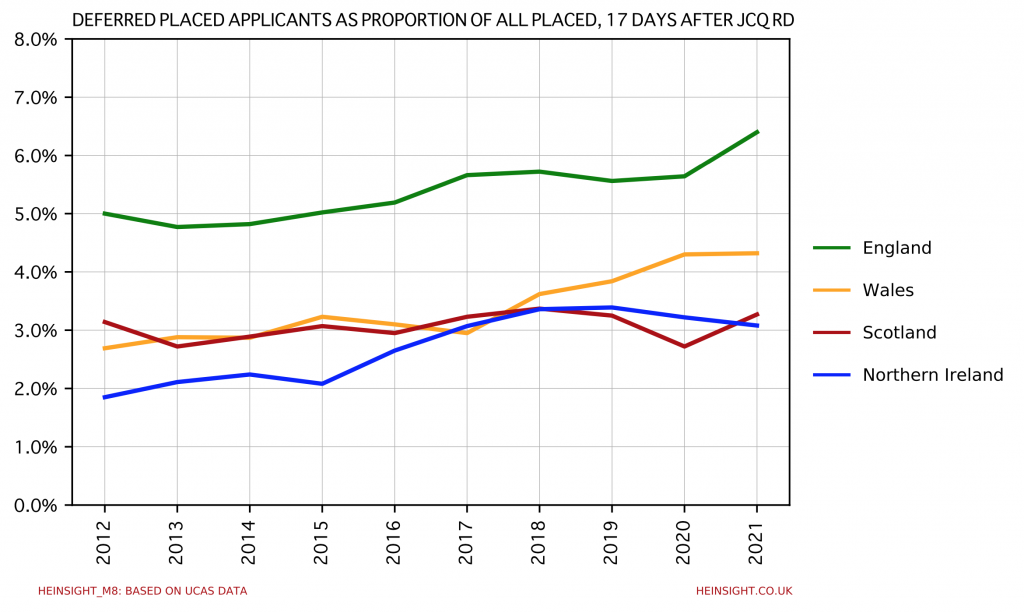
Within the UK, it is applicants from England that continue to be most likely to defer and that have contributed most to the rise in the overall UK rate, although the rate for Scottish applicants has risen also. Welsh applicants meanwhile have deferred at almost exactly the same rate as in 2020 and Northern Irish applicants are less likely to have deferred this year than in the last.
At this point it is difficult to gauge how much of this rise in deferrals is due to the preferences or concerns of applicants and how much has been manufactured by incentives to defer offered by over-subscribed institutions. It is however already clear that one of the many admissions hangovers for providers moving into the 2022 cycle will be the substantially higher number of deferred applicants on their books.
The well reported inflation in A Level grades this summer, significantly above even the generosity of grading achieved in 2020 by the u-turn to issue Centre Assessed Grades, is driving a dramatic reshaping of the HE sector.
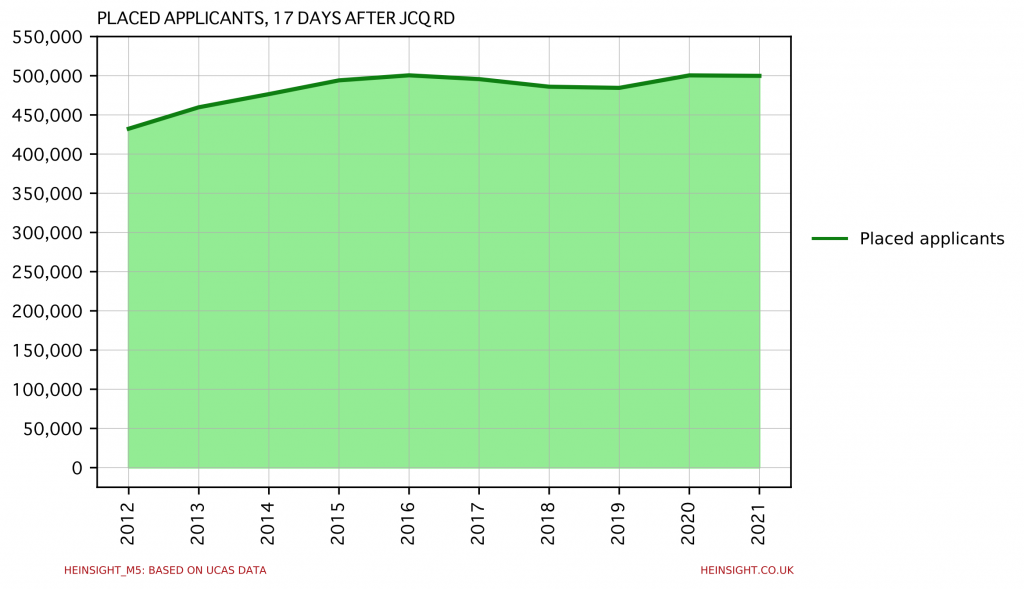
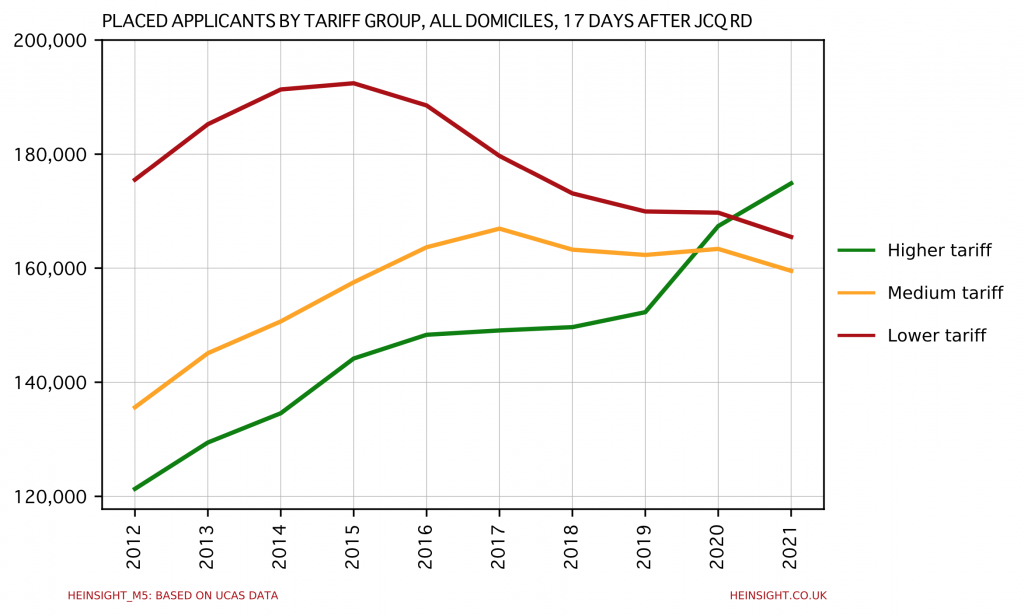
17 days out from A Level Results Day, UCAS reports that there are marginally fewer total placed applicants that at the equivalent point in 2020 – approximately 610 lower at 499,850.
The sector’s undergraduate intake is therefore due to be almost exactly as it was in 2020. Where these applicants have been placed however is a different matter. The higher tariff third of the sector has continued its dramatic growth and is now the largest component of the sector by intake for the first time.
Whilst the higher tariff group’s growth in 2020 was faster it roughly balanced with the growth of the sector overall, leaving the medium and lower tariff groups with little change in their intake overall. This year however, as higher-tariff institutions either deliberately embraced further growth or misjudged the extent to which they needed to curtail offer making to prevent it, even higher grades meant growth for the higher tariff group at the expense of the medium and lower tariff groups.
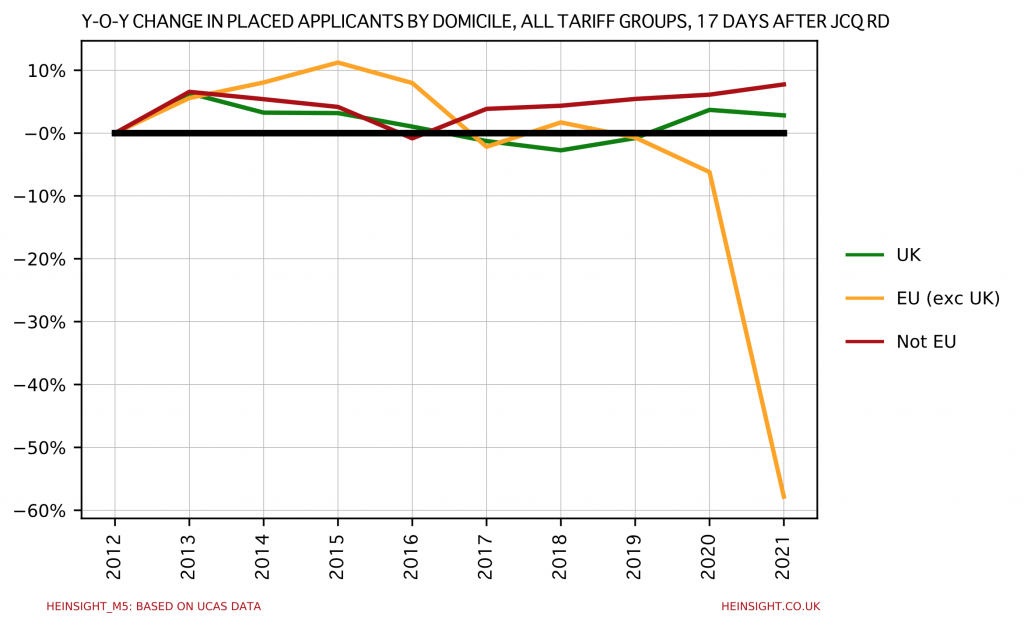
The other high level change this year has been the dramatic drop off in placed applicants from the EU, triggered by the Brexit-induced change in these applicants’ fee status and foreshadowed by the similarly dramatic fall in EU applications observed in January.
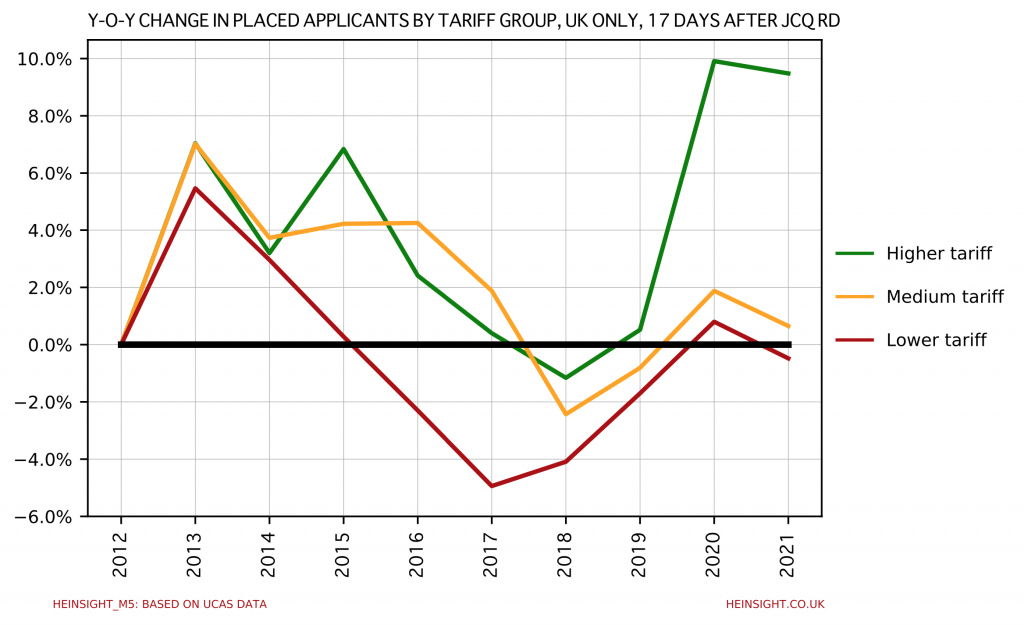
Stripping out this change and focussing only on the UK shows that whilst the medium tariff group did here achieve some growth, the higher tariff group’s growth was even more dramatic, coming in at 9.5% higher than in 2020. This leaves the higher tariff group’s intake a fifth higher in 2021 than pre-covid.
Whatever is to be done about the now pressing need to stabilise A Level grade distributions, the only way that the sector can now navigate the coming demographic surge without a capacity crisis is by finding a way to restore some balance. With many higher tariff institutions now likely to have limited capacity to grow any further for the next few years, it is the many high quality medium and lower tariff institutions that must be supported to grow in the short- and medium-term if we want to meet demand for higher education.
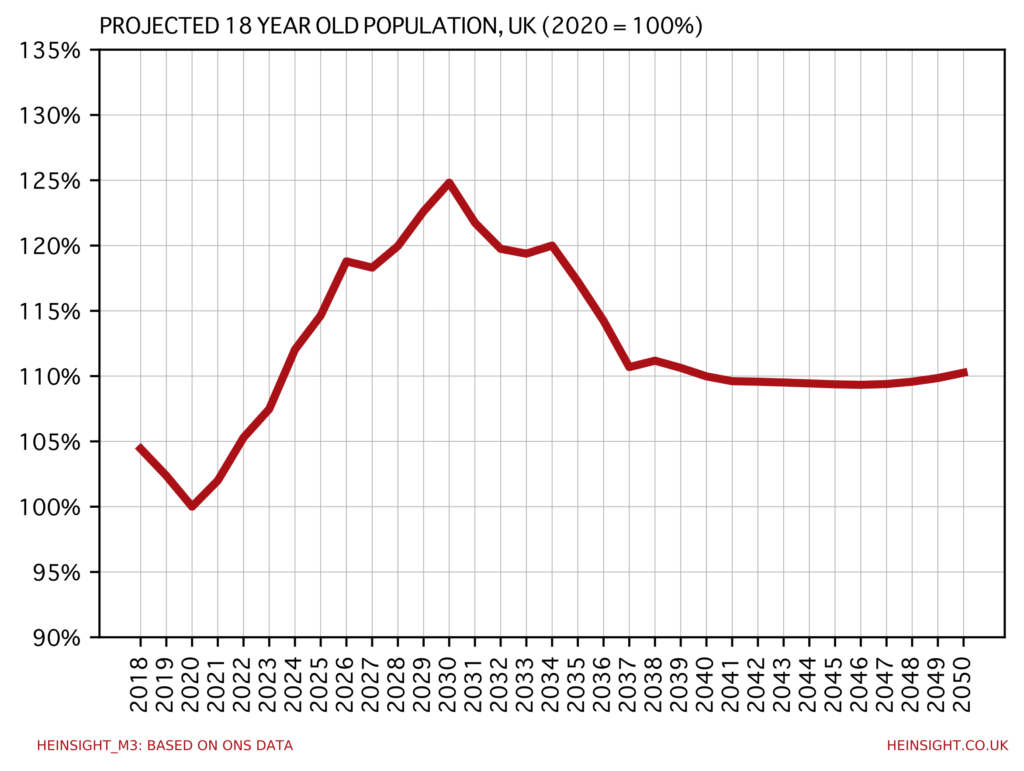
Those involved in recruitment, admissions or planning within UK higher education will be well aware of the ‘demographic dip’ – that the national population of 18 year olds has been declining since its peak in 2009. This trend has in many regards been obscured by rising HE entry rates, particularly since the lifting of student number controls, and stellar growth rates at some institutions will have made it all but invisible for some. With year-on-year falls in the number of school leavers picking up pace since 2017 demographics have however recently exerted significant pressure on some providers (the consequences of 2020’s A Level u-turn notwithstanding).
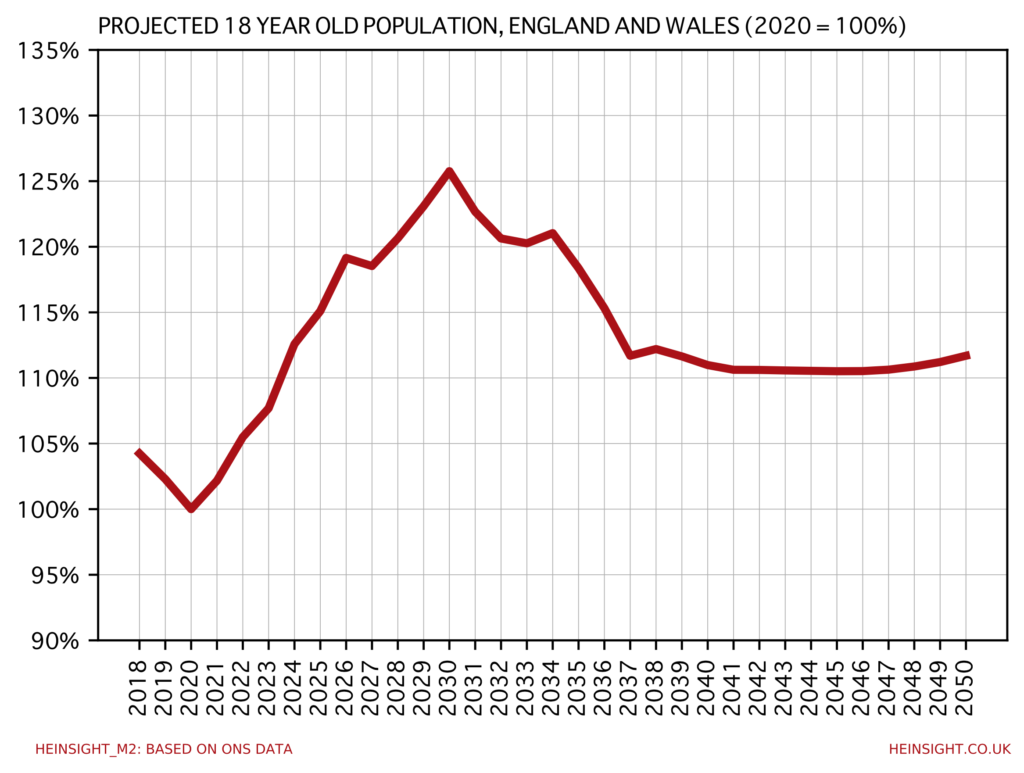
With the trend projected to have bottomed out in 2020, demographics is now beginning to become a story of growth once more. In fact the rate of growth will be greater than the previously experienced rates of decline, such that by 2024 the UK’s 18 year olds will again be as numerous as they were in their 2009 peak. Growth won’t stop there though and is projected to push on to set a new peak in 2030.
Notably England and Wales, the UK nations with the least remaining student number controls/funding cap mechanisms, are projected to experience ever so slightly higher growth than the UK as a whole.
As well as an unequal distribution of growth between UK nations, growth within England will also be unequally distributed between its regions. Institutions will therefore experience the demographic surge to different degrees according to the representation of regions in their recruitment. Those that recruit highly locally or highly unevenly across England are likely to experience a trend significantly different to that which an unadjusted UK-wide view would have them expect.
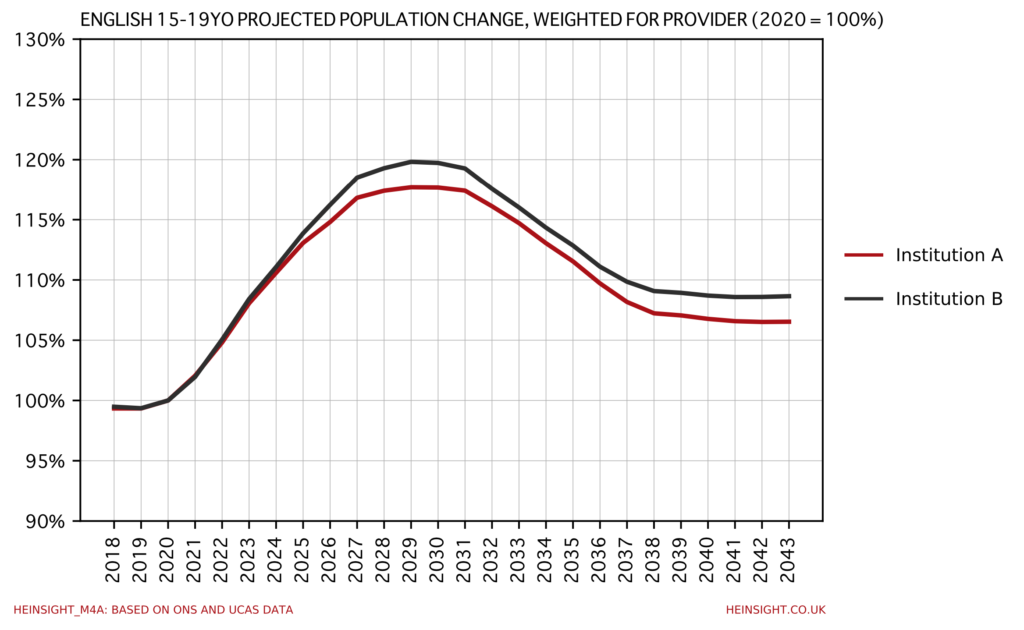
The Office for National Statistics’ population projections broken down by English region only report by age groups (rather than individual ages, as in higher-level projections) but we can re-weight the change in the 15-19 year old group according to the weighting of each region in an institution’s 2020 application pool using UCAS end of cycle data. This exercise allows us estimate the increase in English demand an institution is likely to experience and it reveals some significant differences.
Below I’ve plotted the projected experience of two institutions: Institution A is a University in Yorkshire and the Humber whilst institution B is a University in the South West. Whilst they track very closely for the next few years, Institution A tops out at several percentage points lower than its southern counterpart and this gap persists as we reenter decline and eventually stabilisation. Note the more rounded trend here reflects the broader age group.
All regions are projected to experience some growth and the trend is therefore a positive one for all institutions. Whilst this will be welcome for those who have been facing recruitment difficulties in recent years it shouldn’t be missed that the demographic surge will have wide reaching consequences. Much of the sector is already well-advanced in plans to meet the capacity challenge but with high-tariff institutions having already exploded in size in the past five years many will inevitably have to reimpose harsher selectivity and risk progress in widening participation unless there are meaningful changes in UK HE admissions.
HEPs can and should be making greater use of demographic data to inform student number planning and that means going further than simply looking at national projections. Planners need to know how many of the soon to be much larger group of school leavers will be knocking on their doors and that requires modelling matched to the characteristics of their applicant base. Bringing unequal HE entry rates into the mix only makes this work more crucial for providers reliant on regionally-specific recruitment.