No matter their grade, the real value of HE sector workers’ pay has been drifting downward for years and crashing since the pandemic.
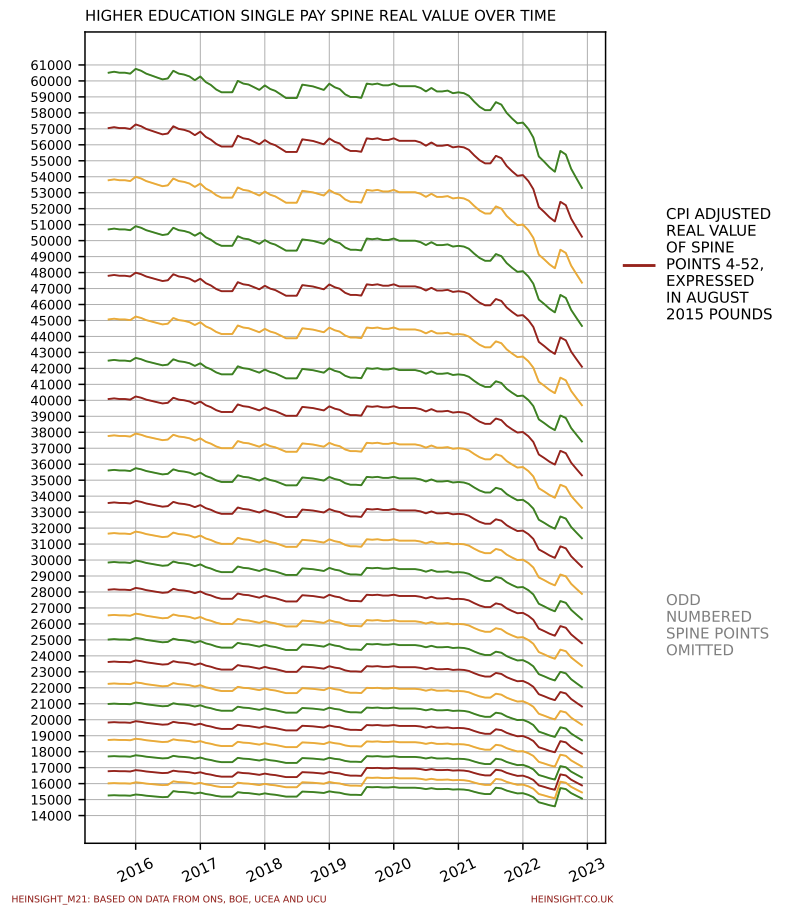
No matter their grade, the real value of HE sector workers’ pay has been drifting downward for years and crashing since the pandemic.
UCAS’s October deadline statistics, released this week, show that the total number of Medicine applicants has fallen by 9.7%, with the number of UK applicants having fallen by 10.8%.
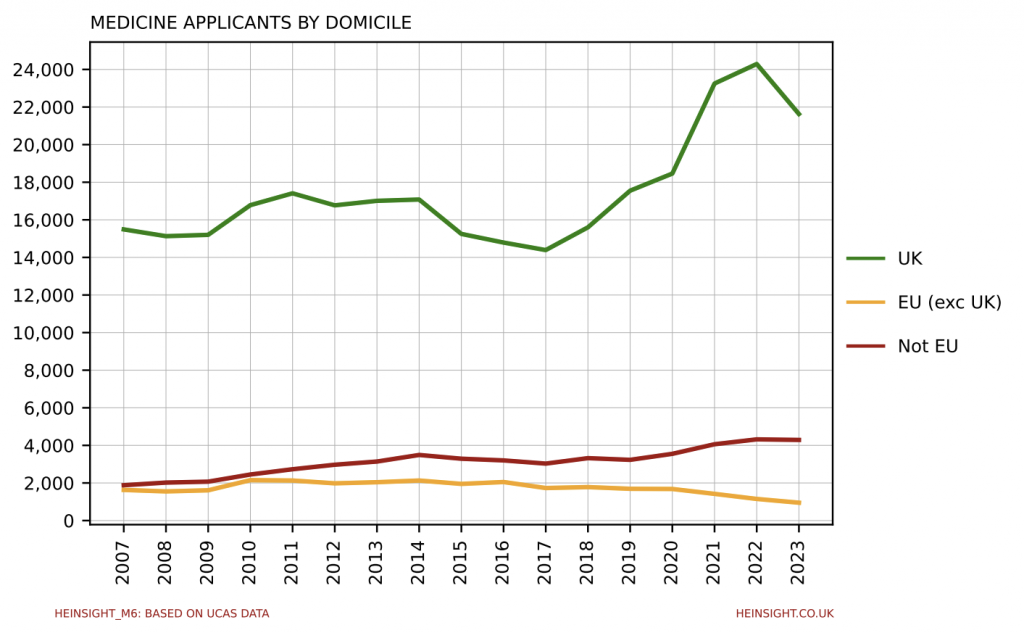
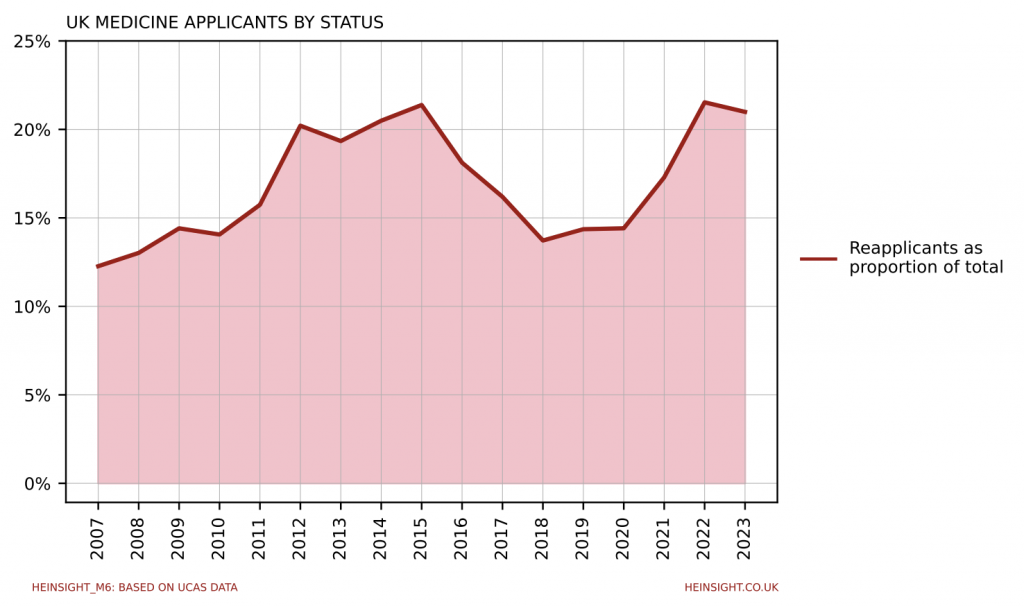
This represents the first time that the number of Medicine applicants has fallen year-on-year since the 2017 cycle. You’ll recall that last year the number of new UK applicants decreased slightly but were outweighed by a surge in ‘reapplicants’. This cycle, these reapplicants have fallen back slightly and the drop in first time applicants has been much more substantial.
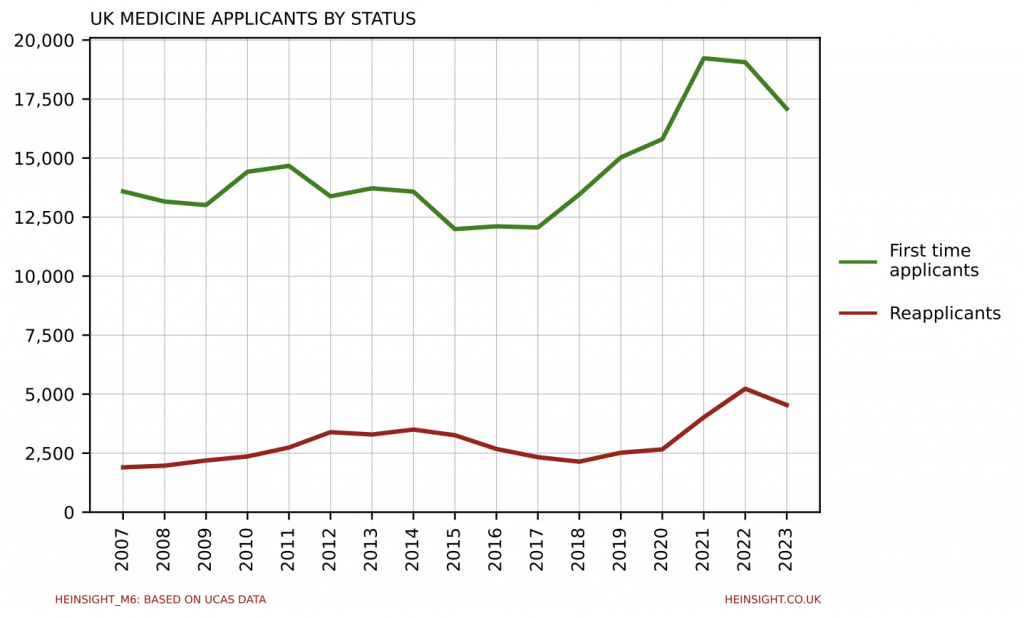
Note however that reapplicants still remain a significantly larger proportion of the total UK Medicine applicant pool than they did prior to the pandemic.
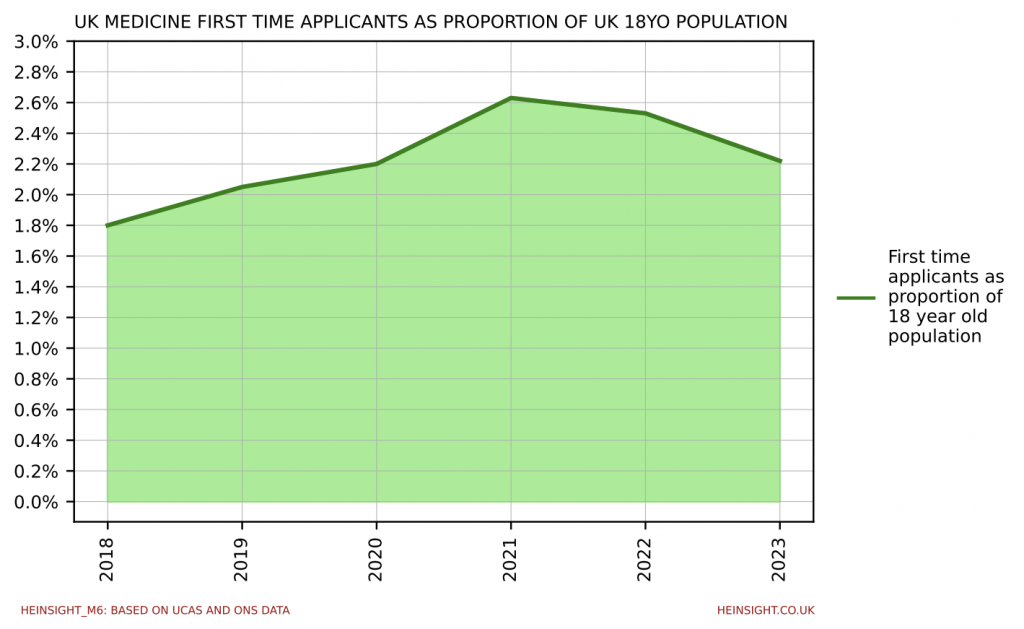
All other things being equal, we might expect the uptick in the number of 18 year olds in the UK population to manifest in growth in the number of Medicine applicants. First time applicants are however falling as a proportion of total 18 year olds, having hit their peak in the 2021 cycle.
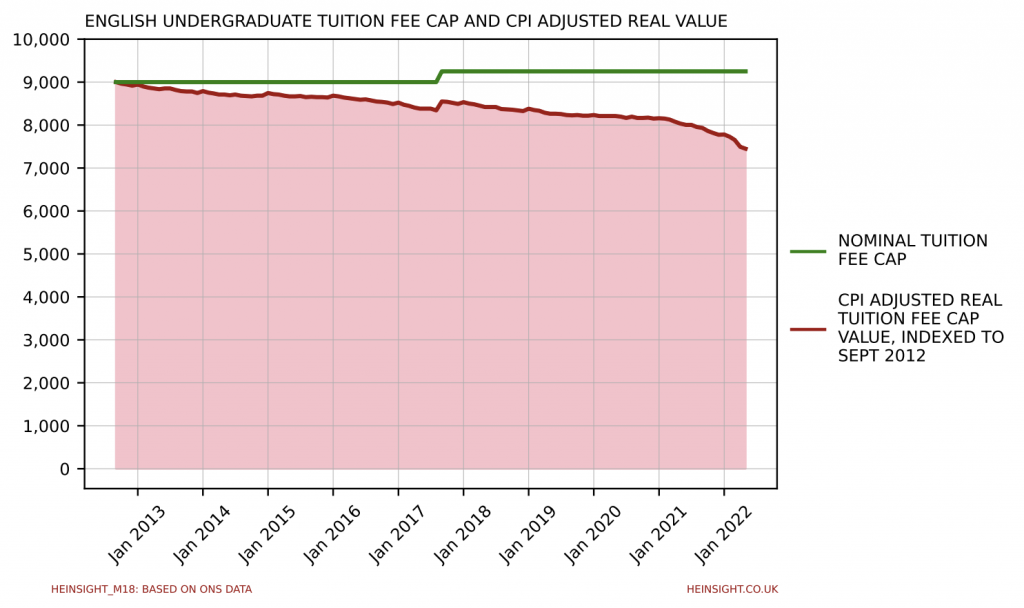
Last month we posted about the falling value of the English undergraduate tuition fee, charting how inflation was eroding the real terms value of the tuition fee cap. Since then, the Bank of England has published its latest forecasts for inflation over the next few years and is expecting CPI to peak at 13.1% at the end of 2022.
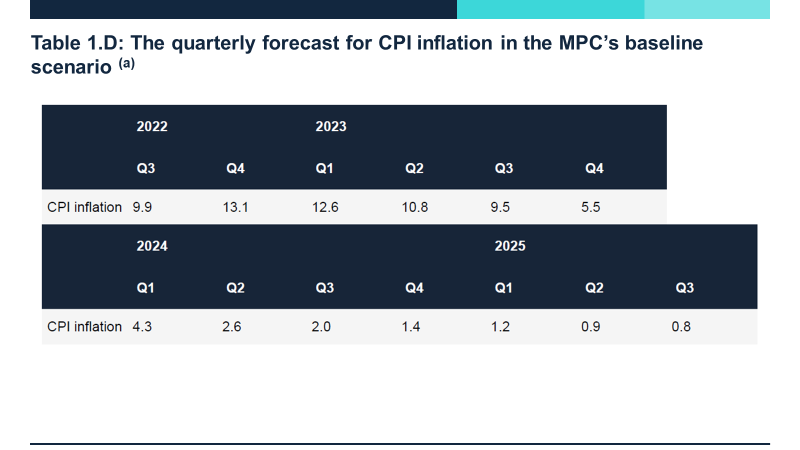
We’ve updated our chart to show the impact of this forecast, should it come to pass, up to the end of 2023.
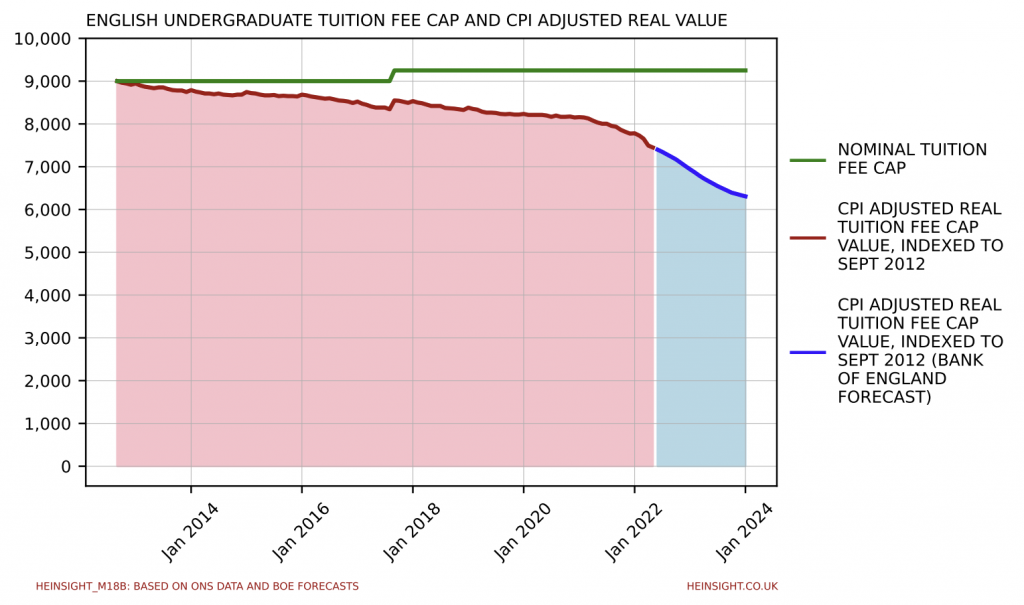
In the forecast scenario, the £9,250 English tuition fee cap would be worth only £6,300 in 2012’s money by the end of next year. This would represent a reduction in funding of approx. 30% since the current funding regime was implemented.
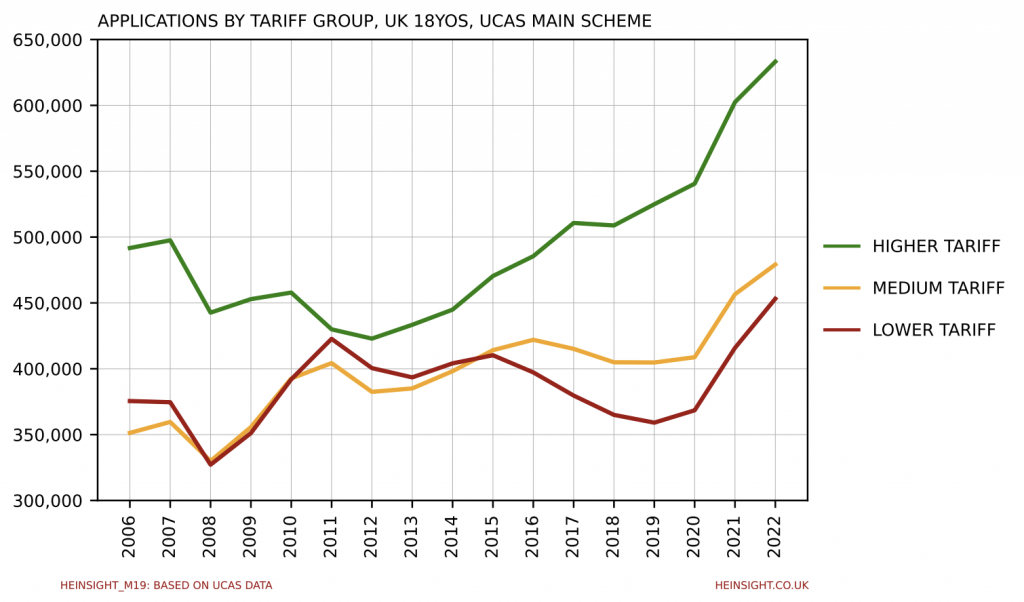
UCAS’s June deadline statistics are out today, giving us the first complete look at all applications submitted within the UCAS Main Scheme (i.e. before Clearing).
With over 3 million applications submitted by almost 700,000 applicants this cycle, every provider tariff group has seen growth in applications.
In the market for UK-domiciled 18 year olds the higher tariff group continues the stellar growth trajectory it’s been on for the past decade, particularly since the lifting of student number controls.
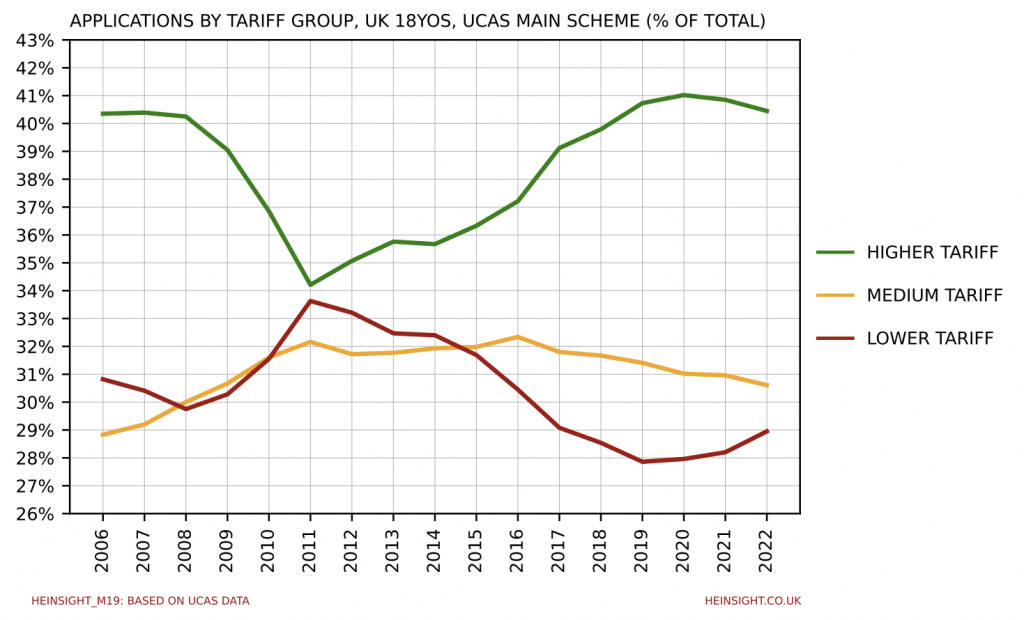
In terms of market share however, the higher tariff group appears to have plateaued and now be dipping slightly, allowing the lower tariff group the reprieve of some growth after years of decline.
Applications from those outside the UK have meanwhile also grown for all. With approx 605,000 applications in total from non-UK domiciled applicants the sector has almost recovered from the sharp drop off in applications from the EU in the 2021 cycle, bringing it a whisker away from it’s all time high of 610,000 in 2020.
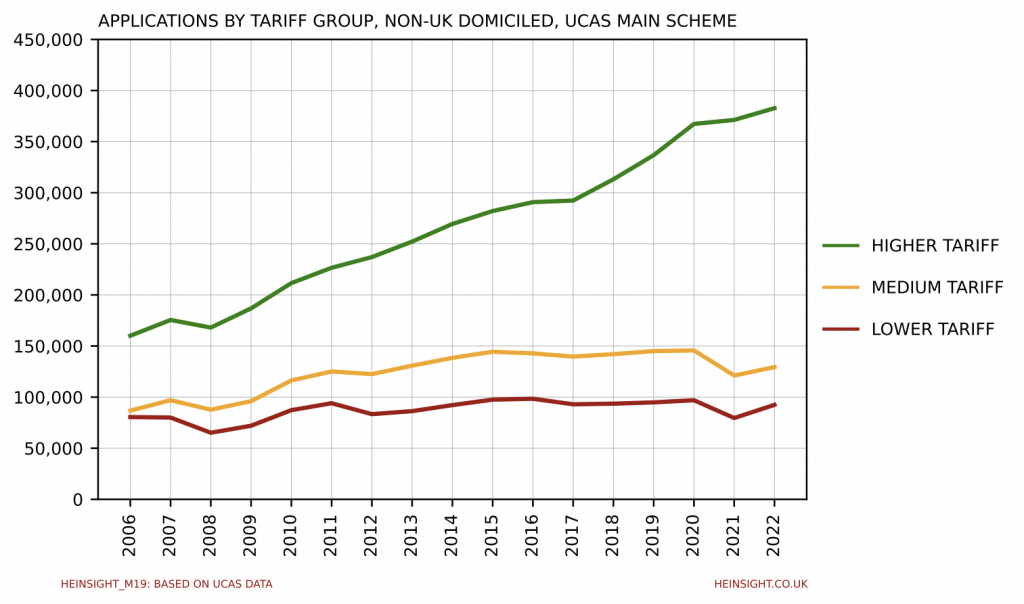
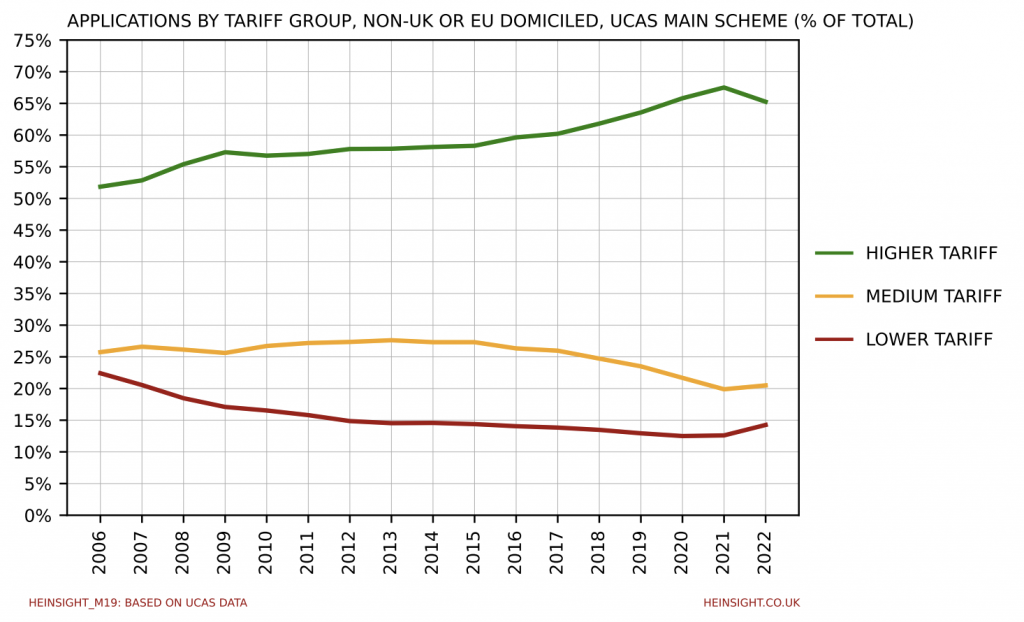
Excluding those EU-domiciled applicants and just looking at applications from the rest of the world shows a persisting long term trend of rapid growth for the higher tariff group and only very recent growth for the medium and lower tariff groups.
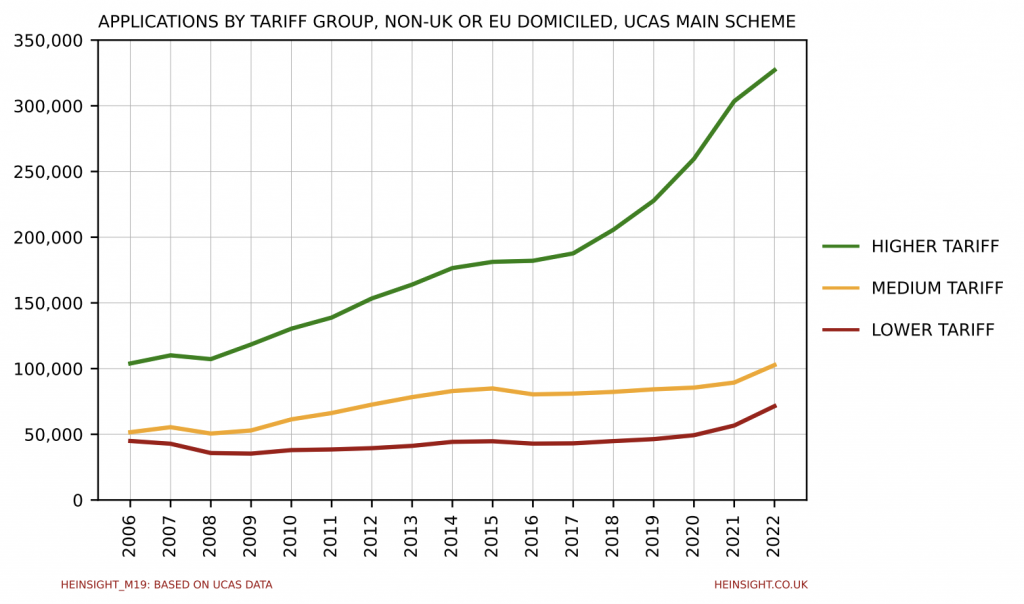
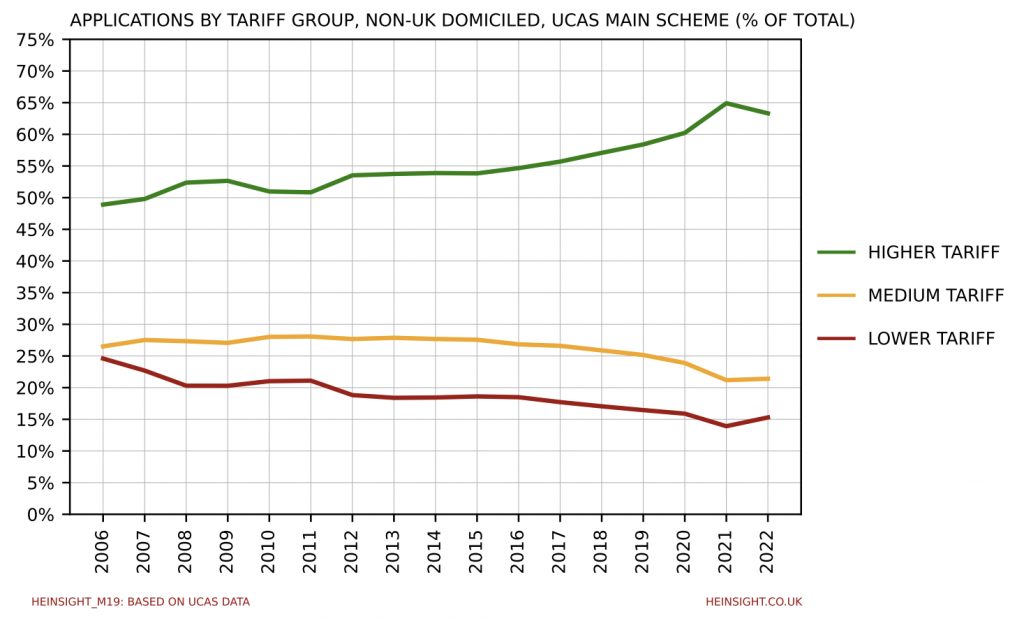
Despite the higher tariff group’s growth however, as with home applicants its overall market share has dropped, which is the first such drop for the group since at least 2006.
A high inflation economy is rapidly exacerbating the problems of the current funding regime for UK higher education.
The current English undergraduate tuition fee cap is now worth only £7,450 in 2012’s money, a drop of 17.2% since the introduction of £9,000 fees. Almost half of that drop in value has taken place since the start of the pandemic.
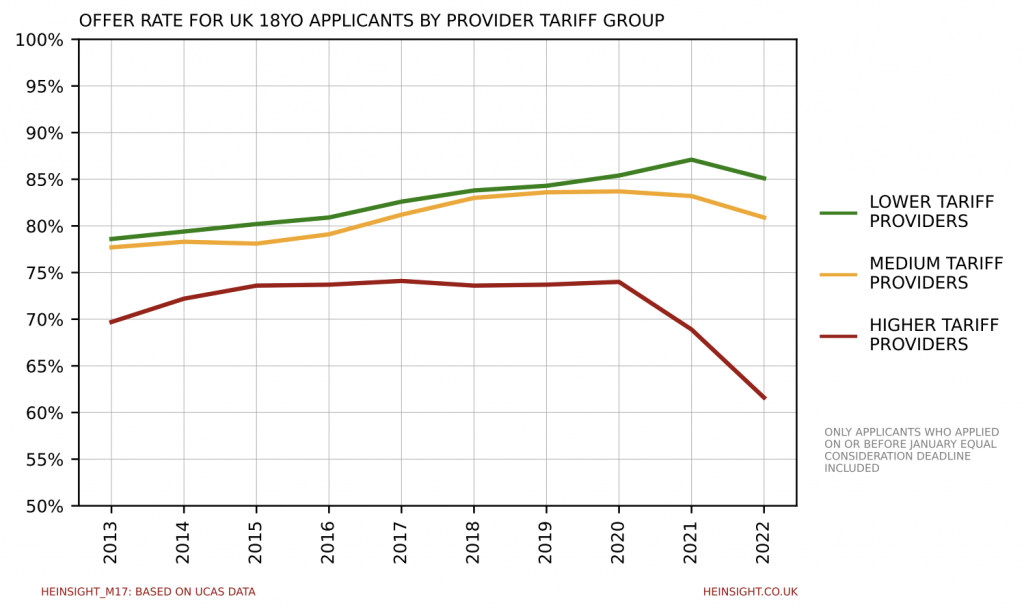
Recently released UCAS data confirms what many have suspected throughout this cycle – higher tariff providers have further reduced their offer rates for UK 18 year olds again this year as the demographic surge delivers ever greater numbers of applicants to institutions still grappling with two years of oversized intakes.
The pay of University vice-chancellors is routinely the subject of scrutiny but over in the Further Education sector the pay of college readers rarely receives much attention.
The Education and Skills Funding Agency does however publish annual English FE college accounts and buried within these are remuneration details for college principals. The latest year’s accounts, covering the year to 31st July 2021, were released last month and so we’ve loaded the data into a quick tool to allow you to explore the rankings.
Here’s a quick look at this year’s top 5 by total remuneration:
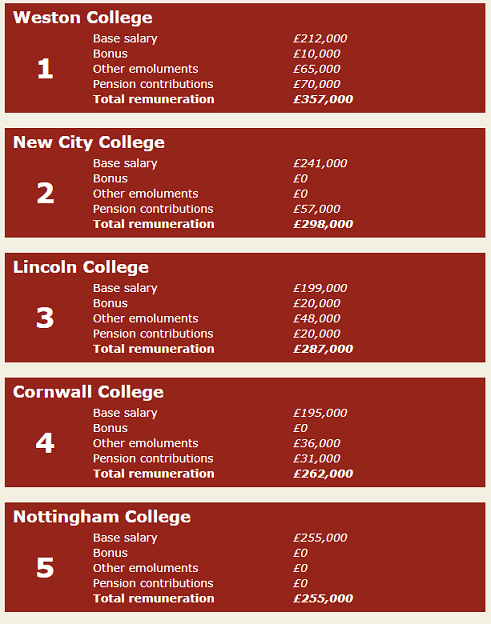
One might think that the pay package for a college principal might correlate quite closely with the size of the college. Plotting the principal’s total remuneration against the size of the college’s student body shows that for the most part this is indeed the case.
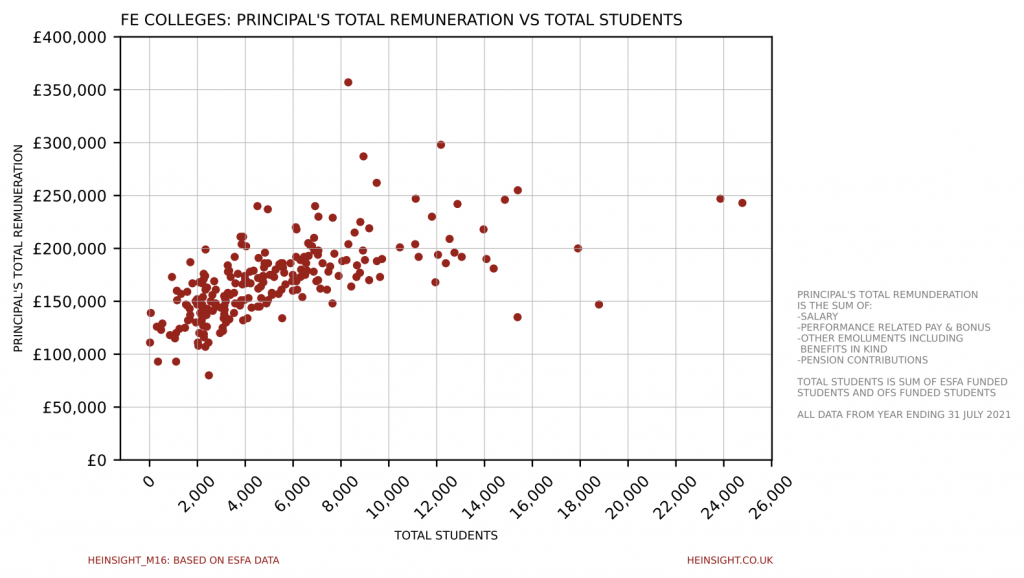
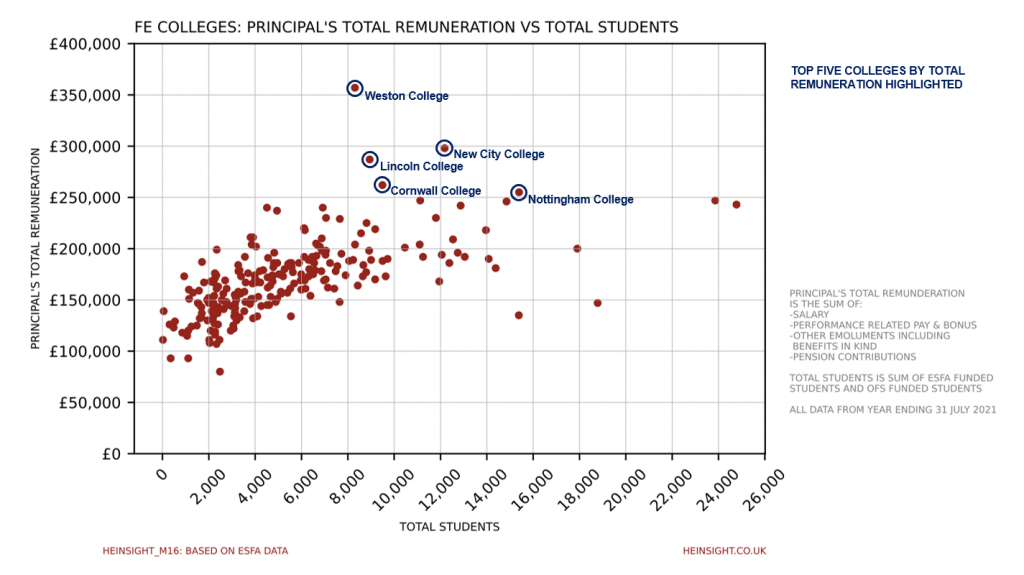
There are however some notable outliers, particularly at the very top of the pay rankings, as we can see here with the the top 5 highlighted:
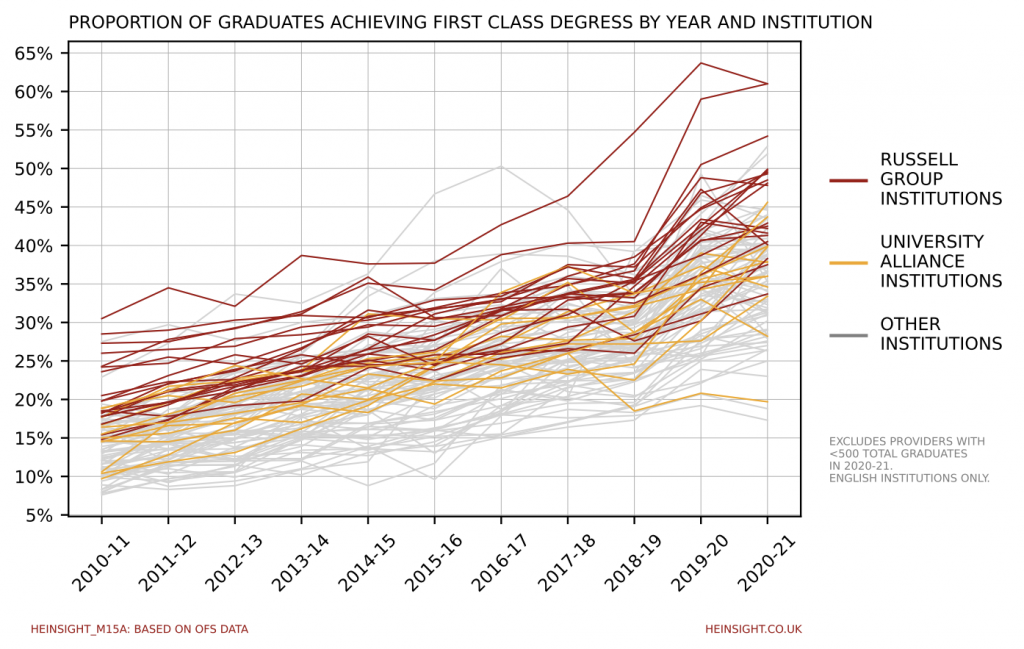
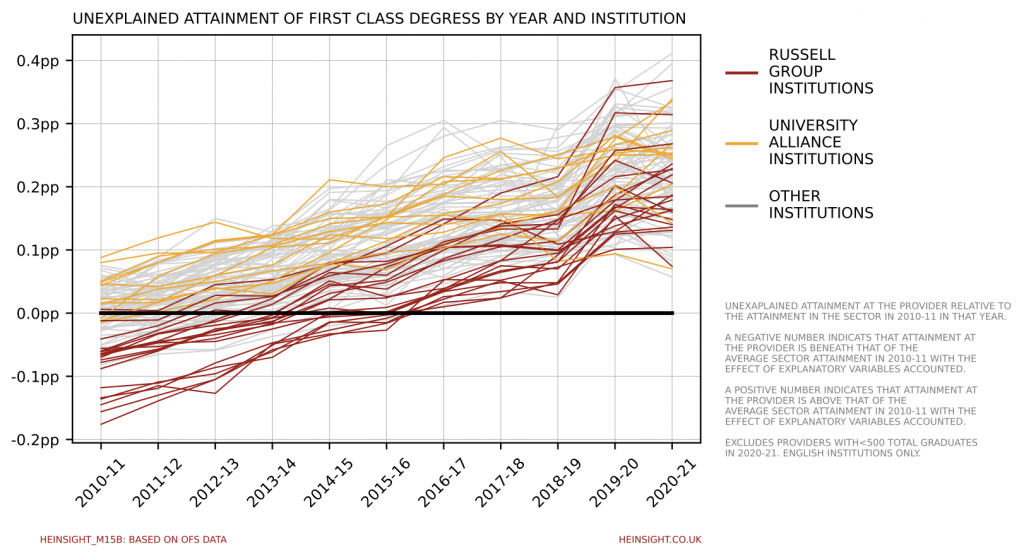
The Office for Students has released new data today on grade inflation at English universities. Take a look at our charts showing the rising proportion of graduates achieving first class degrees across the sector and the rising number of these first class degrees that the OfS consider ‘unexplained’.
Read the full OfS analysis here.
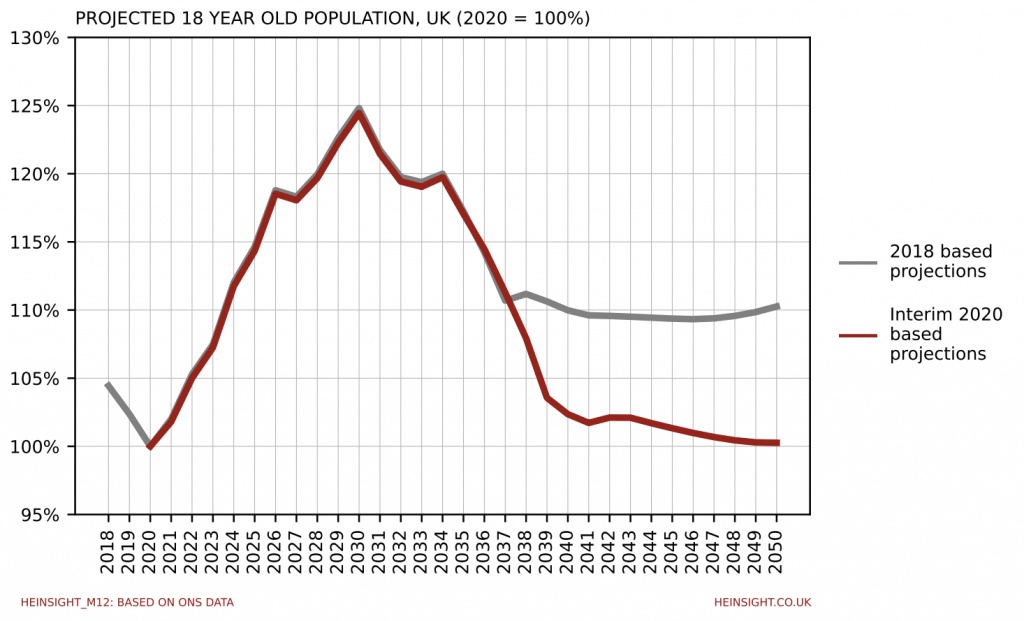
The Office for National Statistics this week released its ‘2020 based interim’ UK population projections, offering an update on the previous ‘2018 based’ series. The dramatic increase in the number of 18 years olds as we progress through this decade that was indicated by previous projections – the demographic surge that is now well known to the sector – has gone no where and has been subject to only very minor revisions. Longer term however these new projections look strikingly different to what we’ve seen before, with major downward revisions to the anticipated 18 year old population from the late-2030s onwards.
The ONS previously anticipated the 18 year old population of 2040 to be 10.0% larger than that of 2020 but it now estimates it to be only 2.4% larger. Meanwhile whilst it had previously thought 2040 would be close to the post-surge trough, with some renewed growth having been achieved by 2050, it now expects decline to continue throughout the 2040s. By the time we reach 2050 it’s now expected that the 18 year old population will only be 0.3% larger than it was in 2020.
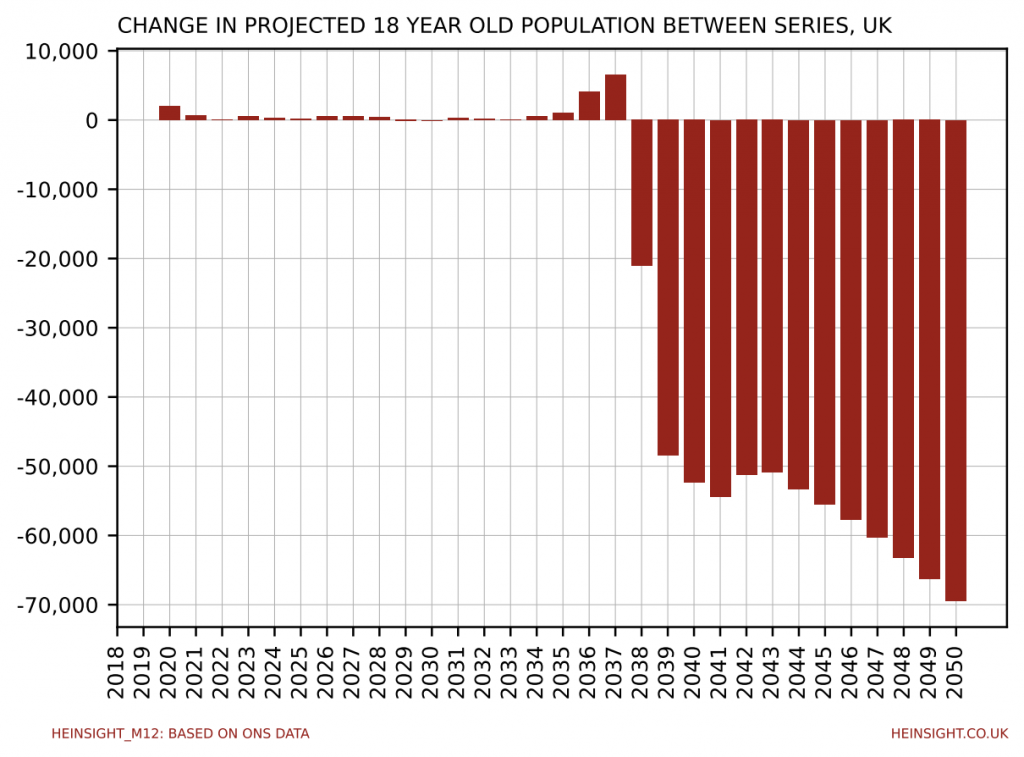
It’s no surprise that the dramatic revisions to these projections begin from 2038, seeing as that’s precisely the point at which we start talking about people that had yet to be born in 2020. The small uplift in 2037 is worth around 6,500 18 year olds and is likely largely due to the ONS’s elevated assumptions of net inbound migration (from 190,000 per year to 205,000 per year).
Once we have to begin estimating future births however we encounter some serious changes likely resulting from the ONS adjusting its assumption of the average number of children per woman down from 1.78 to 1.59. The outcome is 21,000 fewer 18 year olds in 2038, 52,000 fewer in 2040 and 69,000 fewer in 2050.
Whilst the sector can be confident that the anticipated demographic surge will still arrive as promised, what the future looks like after the surge falls away now looks very different. It seems that demographics may well turn against the sector as quickly as they started helping it.
Demographics are of course only one factor among many that determine demand for HE. University leaders already have their hands full trying to understand any number of potential changes to the funding policy landscape that could boost or curtail demand long before we reach the 2040s. Providers looking to take decisions soon to lay the groundwork for success 20 years from now, as many need to, should however take this opportunity to both revisit their assumptions and prepare themselves for this to not be the last time that the future changes before we reach it.
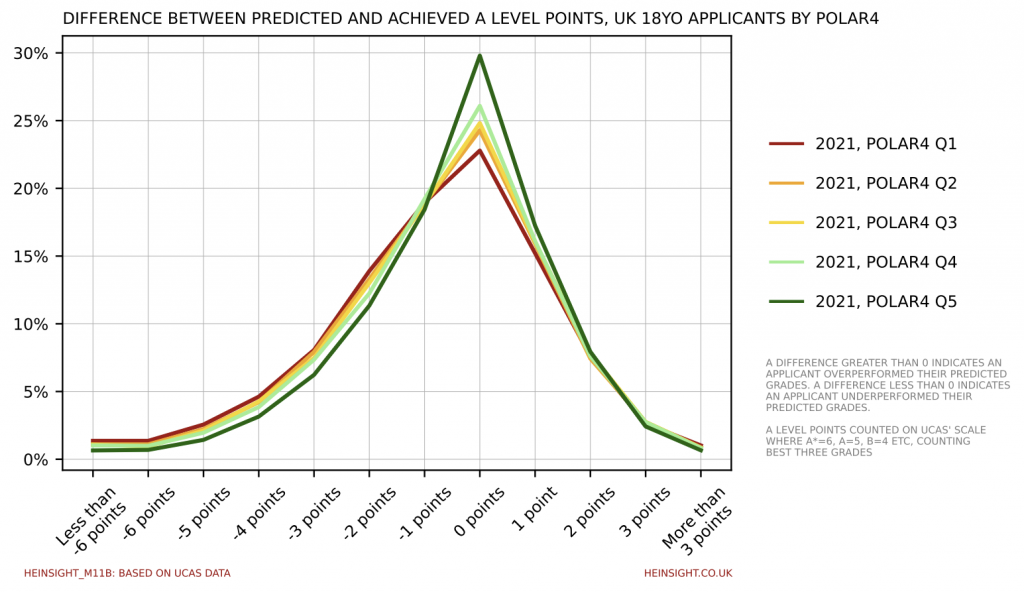
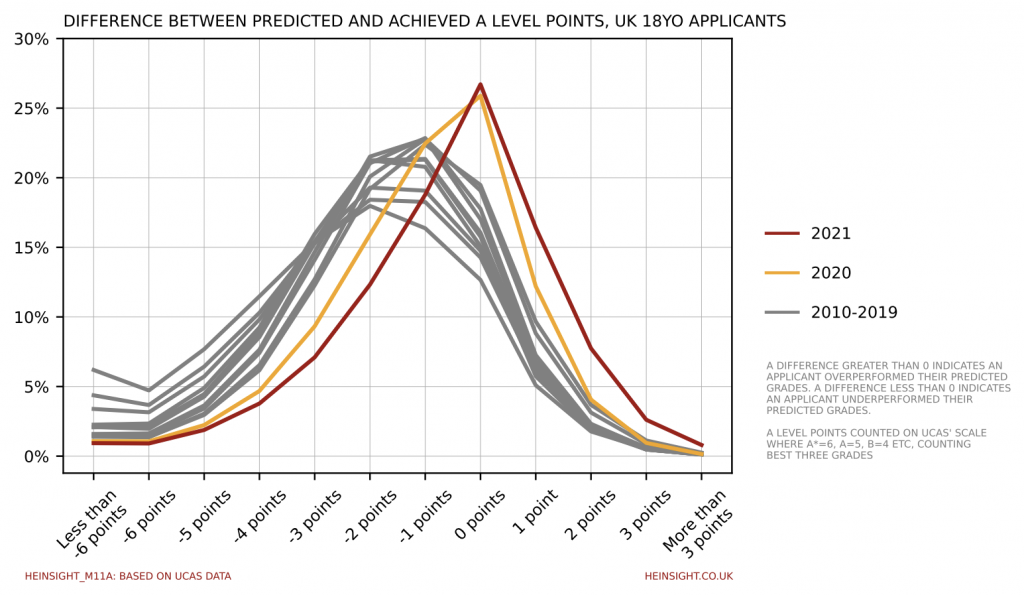
UCAS’ release of its sector-level end of cycle data resources this week has given us an opportunity to interrogate the impact of a second year of dramatic A Level grade inflation in a new way.
Included in the dataset is a measure of difference between an applicant’s predicted and achieved grades. Plotting the distribution of this difference clearly shows the extent to which we have departed from pre-Covid precedent, with more applicants than ever before achieving or over-achieving their predicted grades.
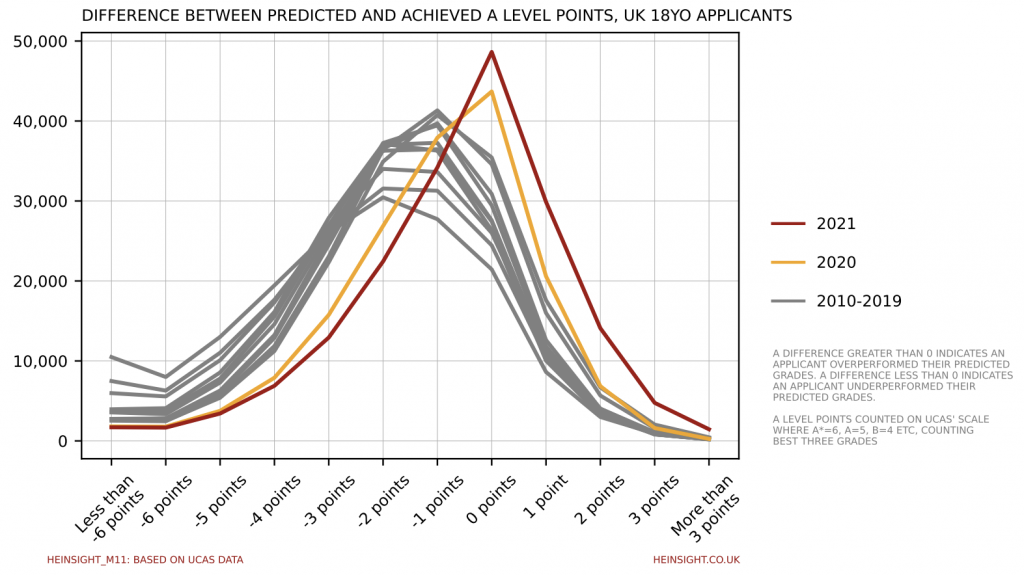
Looking at each difference group as a proportion of the total confirms that 2021 further cemented the trend established in 2020 for the most likely outcome to be for applicants to achieve exactly (equivalent to) their predicted grades. Prior to the pandemic the most likely outcome had been slowly shifting from underperforming by one grade to underperforming by two grades.
If we look back to 2019 and split by POLAR4 quintile, we can see that the less likely those around you were to enter higher education the more likely you were to underperform your predicated grades.
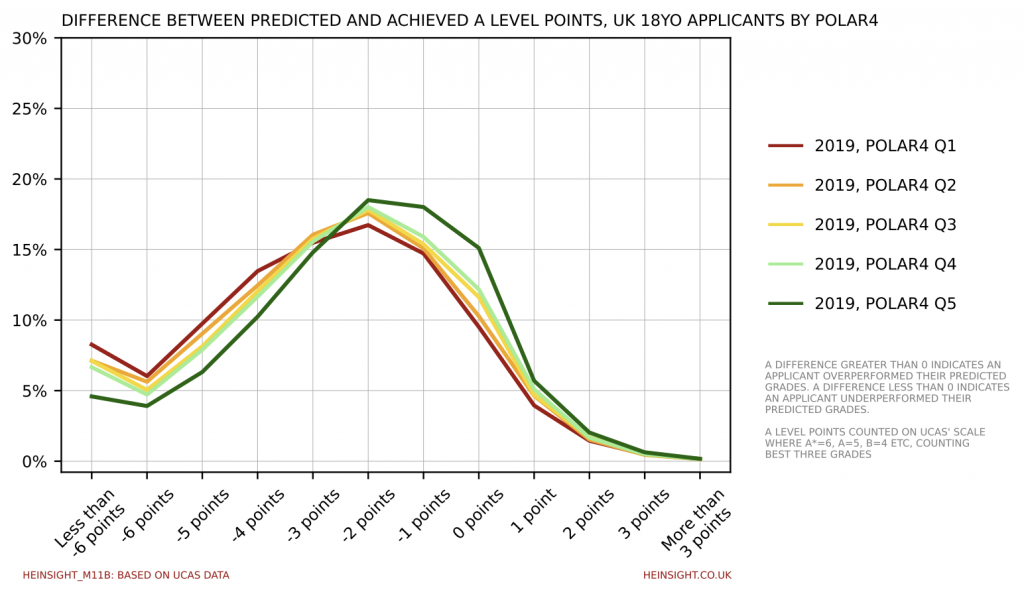
Two years into awarding grades without exams and, despite a very differently shaped distribution, this trend still holds. 58% of Quintile 5 applicants (those from postcodes with the highest HE entry rates) achieved or overachieved their predicted grades, whilst only 49% of Quintile 1 applicants (those form postcodes with the lowest HE entry rates) did the same.