UCAS’ release of its sector-level end of cycle data resources this week has given us an opportunity to interrogate the impact of a second year of dramatic A Level grade inflation in a new way.
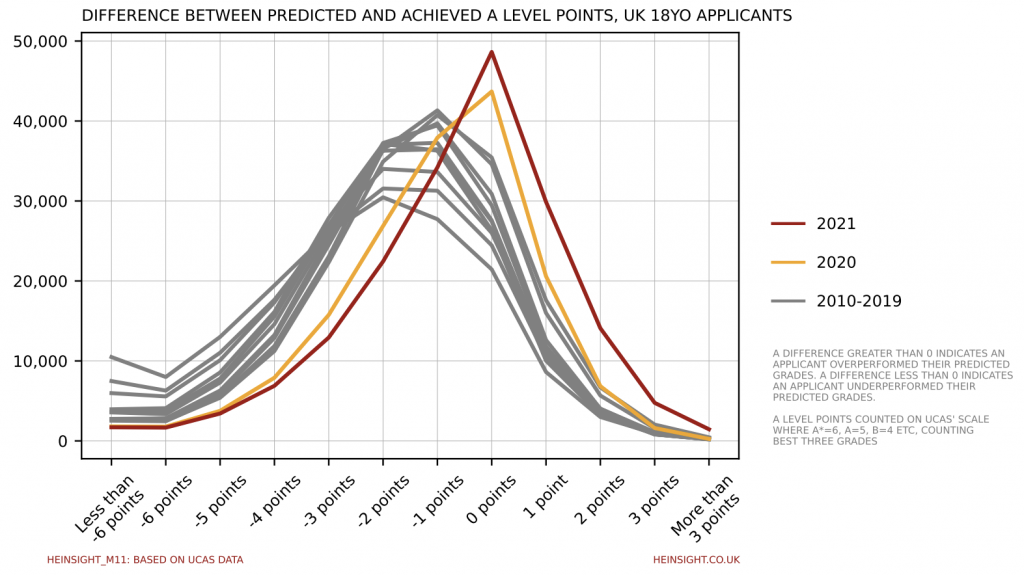
Included in the dataset is a measure of difference between an applicant’s predicted and achieved grades. Plotting the distribution of this difference clearly shows the extent to which we have departed from pre-Covid precedent, with more applicants than ever before achieving or over-achieving their predicted grades.
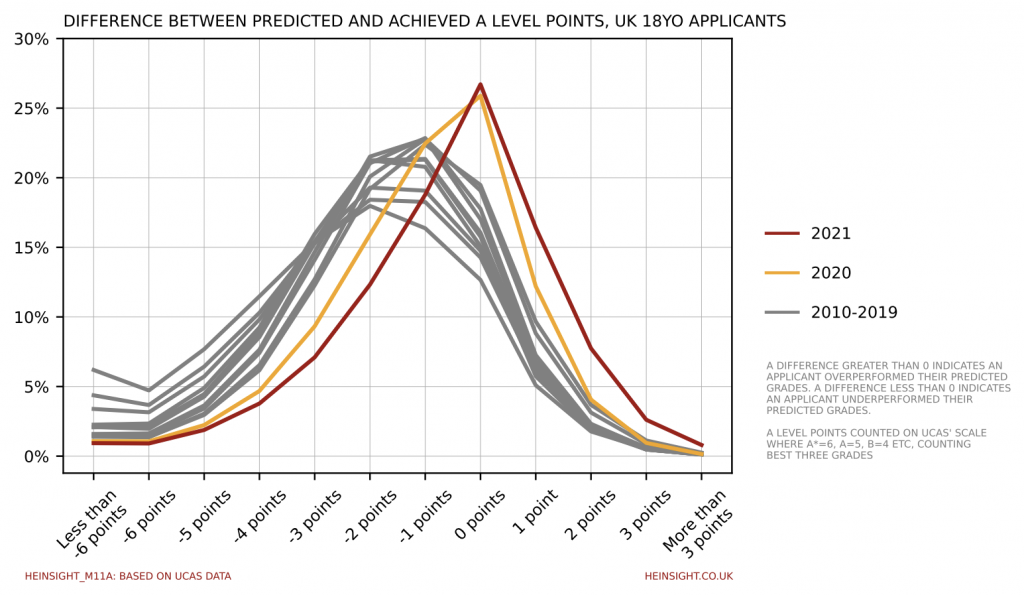
Looking at each difference group as a proportion of the total confirms that 2021 further cemented the trend established in 2020 for the most likely outcome to be for applicants to achieve exactly (equivalent to) their predicted grades. Prior to the pandemic the most likely outcome had been slowly shifting from underperforming by one grade to underperforming by two grades.
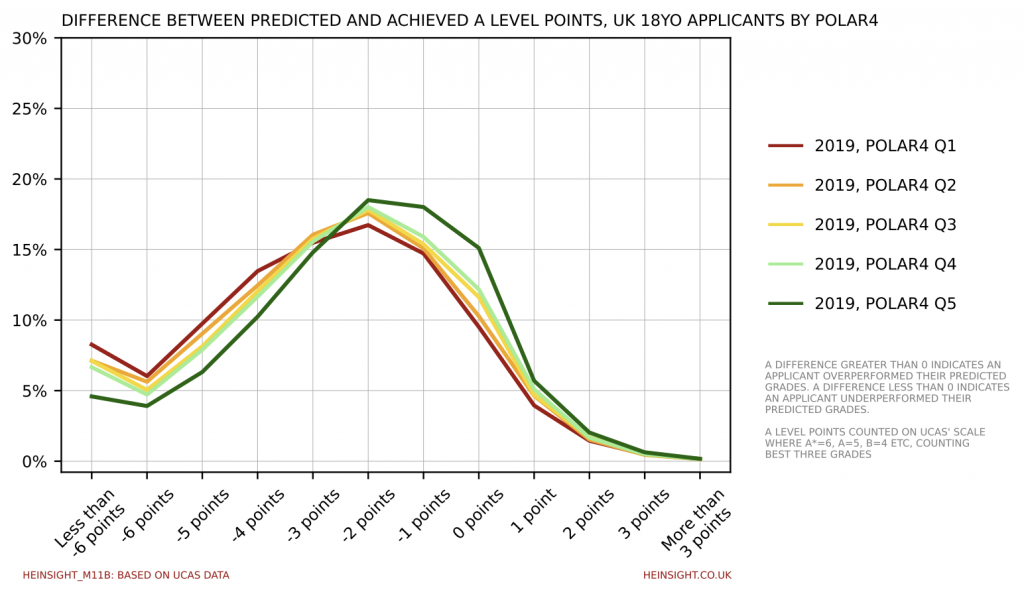
If we look back to 2019 and split by POLAR4 quintile, we can see that the less likely those around you were to enter higher education the more likely you were to underperform your predicated grades.
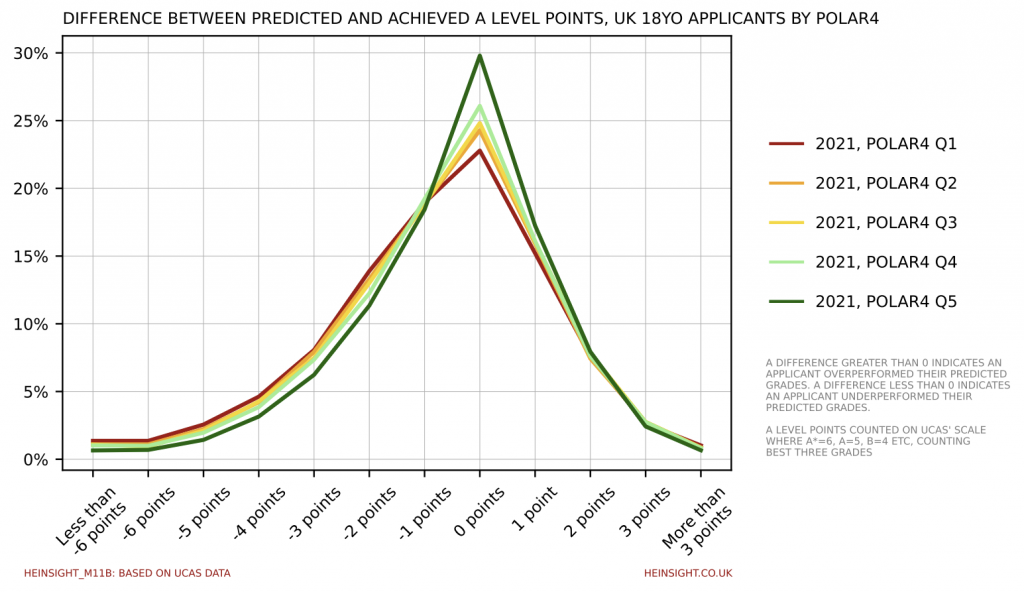
Two years into awarding grades without exams and, despite a very differently shaped distribution, this trend still holds. 58% of Quintile 5 applicants (those from postcodes with the highest HE entry rates) achieved or overachieved their predicted grades, whilst only 49% of Quintile 1 applicants (those form postcodes with the lowest HE entry rates) did the same.